Showing posts with label Performance testing. Show all posts

Thursday, August 11, 2016

Looking under Froome's hood. Again.

I posted this item in December 2015 after some data on physiological testing of Chris Froome was made public in a mostly PR piece. Have a read there first if you haven't already done so.

Today I saw the published science paper was released and from the abstract I pulled out a few extra pieces of information, namely Froome's gross efficiency (23% at ambient conditions), power at blood lactate level of 4mmol/l (419W). His reported weight for the test was 71kg, which is likely above his racing weight.

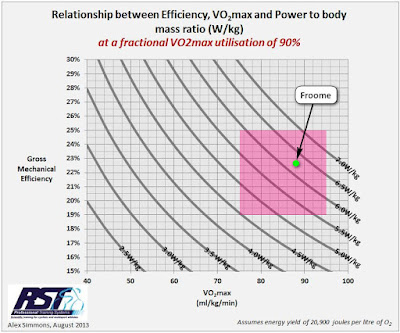
So I thought I'd do up another chart, this time fixing the gross efficiency and VO2max values, and plotting the curve of aerobic power in W/kg terms versus fractional utilisation of VO2max:


The relationship between aerobic energy yield per litre of oxygen, gross efficiency, VO2max, fractional utilisation of VO2max and power output is outlined in this earlier blog post.

So what can we make of this?

1. A TdF winning cyclist has the physiology you'd expect of a TdF winning cyclist. That should be hardly surprising.

2. Froome has both high VO2max and high gross efficiency, which is a killer combo. Neither represent out of this world values. What that means is Froome's sustainable aerobic power output is then a function of his fractional utilisation of VO2max, and FUVO2max at threshold is a highly trainable aspect of one's fitness, more so than gross efficiency or VO2max.

3. The sustainable power as measured in this test was at a blood lactate level of 4mmol/litre, which is an arbitrary level for such testing. What any individual rider's BL level is at their actual "threshold" is quite variable, often somewhat higher.

4. It would seem that Froome's fractional utilisation of VO2max at this power level was ~86-87%. That's a pretty reasonable value for longer duration efforts of at least an hour for highly trained cyclists and it can quite feasibly be higher than that at threshold power, and certainly higher over shorter durations, e.g. 15-20 minutes.

5. The testing was also conducted at high humidity (60%) and temperature (30C) and somewhat interestingly Froome's gross efficiency was higher (23.6%) than when tested at ambient temperature (20C) and humidity (40%). That would add ~0.15W/kg at threshold, a very handy result for hot days. The reported his sustainable power was 429.6W at high humidity and temperature versus 419W at ambient temp and humidity. That power difference of 10.6W / 71kg = 0.15W/kg.

6. Weight. I'd expect Froome's race weight would have been a few kgs less than at the time of testing. e.g. 67kg at same power would add 0.35W/kg to threshold power.

Doping? Once again, this sort of data tells us nothing about any rider's doping status.

Read More......

Friday, December 04, 2015

Looking under Froome's hood

A little over two years ago I wrote about the relationship between four key underpinning physiological parameters that determine a rider's sustainable power output:

  • VO2max
  • Energy yield from aerobic metabolism
  • Efficiency
  • Fractional utilisation of VO2max at threshold


I don't propose to repeat myself, so go here to read that first if you'd like a more detailed explanation.

Data on some physiological testing by Chris Froome was released earlier today, so I thought I'd put a marker on one of the charts I posted in that earlier item to see where he sits.

I took the data from the cyclingnews article linked below:
http://www.cyclingnews.com/news/chris-froomes-physiological-test-data-released/

In it the key 2015 data are listed as:

Weight: Test: 69.9kg, TdF: 67kg
VO2max: Test: 84.6ml/kg/min, TdF weight adjusted: 88.2ml/kg/min
Threshold power (20-40 min): 419W
W/kg: 5.98W/kg, TdF weight adjusted: 6.25W/kg

So given we are talking 20+ minute power, a fractional utilisation of 90% of VO2max for an elite athlete is not unreasonable, so here's that particular chart, and overlayed on that is a pink box defining the area covering a range of VO2max from 75ml/kg/min to 95ml/kg/min and gross efficiency range from 19% to 25%. You'd expect elite cyclists to be somewhere in that range.

Froome's estimated TdF VO2max and 20+ minute power/mass are then shown by the green dot:


What can we infer from this?

Not a lot really, other than the data are in line with what you would expect for a rider with the performances of a grand tour winner. Certainly the physiological values are in line with historical data on plausible physiological parameters for elite aerobic endurance athletes.

As far as informing on doping status, as with power meter data and climbing power estimates, it tells us SFA. In any case I doubt it will change anyone's opinion either way.

Edit: here is a link to the lab report:
https://www.gskhpl.com/dyn/_assets/_pdfs/ChrisFroome-BodyCompositionandAerobicPhysiology.pdf

Read More......

Wednesday, July 01, 2009

The Sins of Sins (Testing FTP #2)

One of the most frequently referenced items on this good ol’ blog of mine (I can call it old, it’s in its fourth year – that’s officially old in interwebby speak) was an item I penned about ways to estimate your Functional Threshold Power (FTP - maximal quasi steady state average power one can sustain for about an hour).

That post was basically an expansion on the original information provided by Dr Andrew Coggan, publicly posted many years ago on the Wattage Forum and dubbed “The Seven Deadly Sins”.

Indeed since writing it, this one blog item has been viewed nearly 45,000 times.
Here is the link to the original post:
The Seven Deadly Sins

It was recently suggested to me (by Steve Palladino) that it might be worthwhile to pen a follow up to that post. One that explores some of the common mistakes people make when attempting to estimate their FTP. So here are a few thoughts on the subject.

As is often the case, none of this is particularly original, most of these are just accumulated tidbits of information and knowledge and it is by no means an exhaustive list. I may even have some of it wrong. You may have others worth adding or corrections – by all means, let me know – happy to add them to the examples listed.

Before getting into the list – The Sins of Sins – I will say that estimating FTP is important and the reasons for that are outlined in my previously linked post. It's not important in a “curing cancer” kind of way, but getting it right to at least a reasonable level of accuracy is pretty darn handy as there are many other very useful facets of training and racing with power that rely on having a good FTP estimate.

One doesn’t need to be completely anal about it and testing really often is not typically necessary (a few times a year is usually enough – the appropriate frequency depends on individual circumstances). Also nailing it down to the watt is not necessary either, the nearest five watts is typically more than sufficient.


The Sins of Sins – Top 10 (in no specific order):
SOS #1 – Not testing at all
SOS #2 – Not using an accurate power meter
SOS #3 – Using inconsistent methodologies
SOS #4 – Not replicating riding conditions in testing
SOS #5 – Ignoring signs that FTP has changed
SOS #6 – 95% of a 20-min mean maximal power = FTP
SOS #7 – Using NP from rides < < 1-hour
SOS #8 – Inappropriate use of the CP model
SOS #9 – Not performing maximal efforts
SOS #10 – “I’ve got an NP buster!”


OK, let’s examine each in a little more detail...

Sin of Sins #1 – Not testing at all
OK, this might seem a bit redundant, but honestly there are people who think they can get away with no testing at all but still want to know what their FTP is. Or that testing is such an impost in the training / racing schedule that it is “harmful” to schedule it. Bollocks.

Given the adage “training is testing, testing is training” then really there’s no excuse for never doing an effort or two in order to nail down one’s FTP more tightly than a lame guess. Stop wondering and go and do it. Gee, I feel better already.

Of course, an experienced eye can often inspect the mass of an individual’s power meter data and probably come up with a reasonable SWAG. But far better to schedule a test and be certain.


Sin of Sins #2 – Not using an accurate power meter
(and/or not using a power meter at all)

This is also a pretty obvious sin of sins but it happens. If you are going to use a power meter, it makes a lot of sense to ensure you are collecting accurate data. Otherwise how are you going to be sure that changes in power output as reported are in fact representative of actual changes in performance?

Check your meter’s calibration and make sure you perform the appropriate torque zero / zero offset procedure so that the data can be considered reliable. Neither is hard to do nor time consuming.

And if you don’t have a power meter, sure, go time yourself up a long steep hill climb and make an estimate of power output using analyticcycling.com, but then what? Without a reliable means to collect power data at other times, then the primary benefits of knowing your FTP and all that flows from it are not accessible. So use the hill climb as a good fitness test but the power estimate is essentially for satisfying curiosity or bragging rights at the coffee shop.


Sin of Sins #3 – Using inconsistent methodologies
This is pretty common. When you start out with a power meter, naturally you’ll want to work out the best, most reliable method for your particular circumstances. Everyone has different terrain to ride on, levels of traffic to contend with, opportunities to do a time trial, or time in which they can safely perform a test where they live, or can’t get outside for months on end, etc etc, so the sin(s) they choose to use as most appropriate to estimate FTP are different.

But once you have settled on a good method, then stick with it and replicate the same protocol each time. By reducing the number of variables that can influence the outcome, the more reliable is the data and what can be interpreted from it.

Examples of consistency might include:
- Using the same venue
- Using the same number of light, recovery ride or rest day(s) before the test(s)
- Performing tests in the same order, with the same break in between
- Performing the tests on the same number of days apart (or always on the same day)
- Using the same equipment
- Looking for similar environmental conditions if possible
- Performing tests over the same distance/duration

Of course it is not always easy or practical to replicate everything, every time, but at least consider these factors when deciding on a test method. Some methods lend themselves to more consistent protocol than others. A time trial over the same course, or undertaking a Maximal Aerobic Power test are examples of those which enable consistency without too much thinking involved.


Sin of Sins #4 – Not replicating riding conditions in testing
This might not be as bad as it can seem at first but it makes sense to at least use a test method using the bike/equipment/terrain/location/bike position etc that comprises the majority of your riding at that stage of your training/season.

This is especially the case when there is likely to be a significant difference in the performance (power) using the test method versus what you would ordinarily be able to produce. For example, if you only ride indoors occasionally and know you struggle to generate the same power as you typically do outdoors, then don’t use the indoor trainer to test FTP.


Sin of Sins #5 – Ignoring signs that FTP has changed
“I had a two hour group run today and my Intensity Factor was 1.07”.
Provided you are not falling for SOS #1 or SOS #2, then be on the lookout for signs that FTP may indeed have shifted significantly. There are a number of them and they include:

- Actual performance not consistent with current FTP estimate, such as AP/NP from a 40km TT that is significantly different from FTP

- An Intensity Factor (IF) > 1.05 for any ride or section of a ride of about an hour

- Regular long intervals at/near FTP becoming “easy(ish)”

- Perceived exertion for rides not consistent with intended level (e.g. a tempo power rides feels more like an endurance ride)

- a steeper than typically sustainable medium term rise in Chronic Training Load. e.g. your CTL has apprently risen at a much higher rate than you would normally expect to sustain without getting ill/niggles/overly fatigued (e.g. > 8 TSS/day/week but maybe less for some)

Now these are signs that FTP may need retesting but are not necessarily good tests in themselves. So ignore them at your peril but don’t jump to inappropriate conclusions or immediately adjust FTP. Gather some additional evidence.


Sin of Sins #6 – 95% of a 20-min mean maximal power = FTP
Well, this method of establishing FTP isn’t one of the listed Seven Deadly Sins in the first place, but it has become such a commonly referred to/utilised method (mainly due to its publication in the excellent book, Training and Racing with a Power Meter) that it gets its own SOS number.

Firstly, the main issue with this common Sin of Sins is that the ratio between 20-min power (or other similar shorter TT duration power) and FTP is not the same for everybody, and neither does the ratio remain static for an individual. One should recognise that due to several factors, not least of which is the contribution of anaerobic capacity and the exact protocol used (e.g. performing a pre-ride blowout effort), that the ratio is likely to be within a range and where someone is within that range is anyone’s guess.

So, FTP might be anywhere in the range of, say 90% to 98% of 20-min max average power. Personally, my FTP has been at both 92% and 96% of my then 20-min max average power. So, by all means use 95% of 20-min max power as a starting point but remember it may well be out by some margin and it would be wise to use an additional or alternative method to validate your FTP estimate.


Sin of Sins #7 – Using NP from rides < < 1-hour
“My 20-min max NP from that crit was 378 watts, so is my FTP 95% of that, i.e. 359 watts?”

Er, no.

Apart from falling for SOS #6, the efficacy of the Normalised Power algorithm in providing a “normalised iso-power equivalent” begins to drop somewhat as the duration shortens to substantially less than one hour. 20-minutes is in that grey zone. 30-minutes ain’t too shabby but I think anything less than 40-50 minutes is stretching the envelope a bit much for a reliable number from which to make an estimate of FTP.


Sin of Sins #8 – Inappropriate use of the CP model
The Critical Power (CP) model is a useful way to estimate FTP. See my previously linked item on the Seven Deadly Sins to find out a bit more on how it works.

The calculation of CP is sensitive to both the way data is collected and the data chosen to input into the model. So ignoring reasons for these sensitivities can introduce unwanted errors. Common SOS#8 mistakes are:

- Using data from inappropriate test durations. Ideally you will want data from within a range of durations – typically tests should be at least 3 minutes and no longer than 30 minutes duration. Tests from very short (e.g 1-minute) or long durations (e.g. 60-min) tend to skew the calculations somewhat. Besides, if you have a 60-min test, then CP is somewhat redundant.

- Using data from test durations that are too close to each other, e.g. 3-min and 6-min. It is far better to use one test of ~ 3-6 min and one of ~ 20-30-min. Can also include another from a duration in between but two really good points with sufficient spread between them is all that's really needed.

- Using multiple data points which include unreliable data, such as a test that was not truly a maximal effort for the duration or was tainted due to the protocol/method used to collect the data. Far better to have two very good data points than four data points with one or two suspect numbers.

- Not using the same test durations each time. E.g. using a 6-min and a 20-min test and next time using a 3-min and 28-min test. Pick your sample durations and stick with them, within reason. This is not as easy as it seems, since if you are doing a 5-min test, how hard do you go? It can be easier to pick a power level you expect to maintain for the duration and go ’til you blow. But if it becomes a significantly different duration, it may affect the outcome.

- Using a different protocol to collect the data. Principles of SOS #3 apply. If you perform both, say a 5-min and a 25-min test on the same day, then next time do it the same way and in the same order. If you perform the tests on different days, then be consistent about that protocol.

- Similarly, avoid cherry picking mean maximal power data from different rides, e.g. a local TT and last week’s crit and then next time a Level 4 training effort and the hillclimb during the local world’s bunch ride.

- Selecting non-contemporaneous data. Now that’s a big word. What I mean is, you don’t select your best 5-min power from three months ago and combine it with a 25-min test from last week. The data must be from the same time period (I suggest the limit for data collection be approximately one ATL time constant or around 7-10 days)

- Using Normalised Power. Don't. Use Average Power.

- Not weighing yourself or using the wrong body mass for the model (note that this doesn't affect CP calculations, just some versions of the model also quote or calculate CP in W/kg terms).

Note that the CP value calculated by the model is typically a better estimate of FTP than the 60-min power predicted by the model. The 60-min power prediction is usually a bit higher than the CP value.

Note added June 2013:
The Golden Cheetah power meter analysis software has a built in feature that uses the principles of the critical power model to provide a CP estimate based on your power meter files. I am not exactly sure of the means by which GC's implementation derives its estimate, but I suspect it is susceptible to the problem of cherry picking data, using inconsistent data, and possibly not including data from efforts of sufficient duration as mentioned above.

As a result, use of the CP model implemented in this manner routinely overestimates FTP. Initial data as assessed by Dr Coggan indicates a typical overestimation of around 5%. This presumes there is sufficient actual data with maximal efforts across various durations.


Sin of Sins #9 – Not performing maximal efforts
Testing performance requires one to go to the limit, otherwise one can never know where that limit is. There is some sub-maximal testing one can do, such as determining lactate threshold in the lab but for the purposes of using a power meter to ascertain FTP, then one does need to lay it all on the line.

Of course it goes without saying that one should be sufficiently fit and healthy to perform maximal effort testing. Undergoing testing while health concerns exist may well end up being the biggest mistake of all!


Sin of Sins #10 – "I’ve got an NP buster!"
No you don’t*.
It is 99.99% likely that:
(i) your FTP is underestimated, or
(ii) the duration you are referring to is not about an hour, or
(iii) your power meter data is suspect – reference SOS #2.

* OK it is possible, just highly improbable and some substantive evidence is required before making such a declaration and joining this rare club.

Finally, there’s not much point in taking your track bike to the local velodrome, doing a whole bunch of anaerobic efforts while tooling around the infield in between efforts, racking up some weirdo NP number due to all the breaks and then seeking to use it as guide to FTP. The test needs to be realistic for the purpose. This is a variant of SOS #4.

I’d expand some more on this, like “what the %&%$ is an NP buster?” and “I do so have an NP buster” but perhaps I’ll save that for another day.


OK, that’s enough for today. It was a bit long but hopefully it can help you to avoid some of the more common pitfalls when attempting to estimate your FTP. It's not all that hard.

Good luck and safe riding!

Read More......

Sunday, December 21, 2008

Swiss Watch

"The body responds like a Swiss watch. You just have to figure out how to wind it." - Dave Harris

OK, alright, I got a complaint about my blog. Like, "you haven't posted anything for ages!". Well it's been twenty days to be precise, but who's counting?

I've just been busy with quite a few things, so I'll try a catch up with this post.

Since my benefit night, training has continued along very nicely. In the first three weeks of December I have accumulated a little over 21 hours of riding and 1457 TSS with an average Intensity Factor of 0.83. That means that those hours, on average, were ridden at a level of exertion of 83% of my estimated 1-hour maximal (threshold) power.

Which is a technical way of saying very little training time has been wasted, and all efforts have been quality. Training has basically been a mixture of core endurance rides, solid tempo efforts, threshold tolerance intervals along with some track sprint work.

Here is a pic of the "thin blue line" to date:


Again, you can see the steady progression of the chronic training load (blue line) indicating the continual progressive increase in load/stress being placed on my body. The leg has been holding up well to the increase in workload and the body is also continuing to adapt. How well is it coping though?

Last week I was scheduled to do some performance tests, one a time trial effort of around 16km (10-miles) and the other a Maximal Aerobic Power (MAP) test. While not a formal test, I have also been doing some sprint work at the track to see how my maximal (neuromuscular) power is going.

First up was my time trial at Centennial Park. Here's the power file chart:


An average power of 287 watts over 26 minutes. So TT power is up 39 watts (nearly 16%) on the test I did on 23 September.

I sometimes surprise even myself. That's 9 watts more than same test/venue (albeit on a cold day) on 8 Aug 2006. I was a few kg lighter back then though. For reference, my best power on that course is 328W (and at a lighter body mass as well).

I followed that up with the MAP test on Friday, riding Thunderbird 7 (my indoor trainer bike). Here's the graph:


My MAP was 385 watts (mean maximal 1-minute power during the test). Yikes! That's up 30W (8.5%) on my last MAP test on 25 September.

What's even scarier is that's only 14W shy of my best ever MAP of 399W (as measured by Powertap on a Computrainer). Allowing for some drivetrain power losses for recording with Powertap vs SRM, that still means my MAP has attained nearly 95% of pre-accident levels. That is pretty remarkable under the circumstances. It's only six months since I put the bike into a home trainer and tried to pedal.

What about my sprints?

Well for a couple of Sundays now I have gone to my local track for some sprint work. I am now getting peak power > 1200W on several occasions. Pre-accident, I would regularly be ~ 1350W and occasionally up to 1400W. So sprint power is not too bad either.

So my body is indeed a Swiss Watch. It seems that coach has worked out how to wind it quite nicely!

Of course one of the consequences of that testing is my estimated Functional Threshold Power has gone up from 240W to 275W. Since my daily training stress is calculated relative to FTP, it means that rides have to be at a higher power now to earn the same Training Stress Score.

As they say, it doesn't get easier, you just go faster.

This morning I woke late, and then checked what was on the program today. 2.5hrs, that's what! Holy smoke! OK, so I saddle up, head out the front door and get into it doing a run to Kurnell, being my first proper solo run back out there in the world of Sydney's roads.

A little over 2.5 hours ride time later I get home, with two short stops along the way to remove, dry and replace my leg liner which seems to accumulate the contents of Sydney Harbour while I'm riding.

Average Power: 186W
Normalised Power: 198W
TSS: 130
Distance: 71.4 km

Ironically, I came home via "that gate". It was definitely open when I rode through.

One last thing - I have chatted to my prosthetics specialist George and we will hook up again in the new year to start looking at the design and construction of a leg dedicated to cycling. Picking the right time for that is tricky, as since I am now trimming down, that affects the fit of my stump in the socket. So getting the leg too early might reduce its useful life.

I did however use some of the funds raised to purchase a new leg liner (or as Paul Craft calls it, the big blue condom that goes over my leg) and distal cup (the current cup is looking a bit worse for wear). That was $1300, so the benefit funds are already being put to good effect. I'll now be able to rotate the liners and hopefully get a bit more useful life out of them. Early in the New Year, I'll probably add a third liner to the stable.

So there you have the latest. All going well as far as training goes. More hard work ahead of me though, and probably a few races over the next month.

Read More......

Tuesday, October 14, 2008

The Thin Blue Line

Time for a catch up on how my own training is going.

A couple of weeks ago I mentioned the results of my performance tests, namely a time trial level effort, a MAP test and some sprint efforts. Results were:

Time Trial power (20-minutes): 252 watts
Maximal Aerobic Power: 355 watts
Neuromuscular Power: 1074 watts (5-second max average with a peak of 1109 watts)

Estimated Functional Threshold Power: 240 watts.

So with those results locked away, training has been continuing. One thing to notice is the ratio of TT power to MAP. In my case, my TT power is a relatively low percentage of MAP (or if you like, my MAP is a relatively high percentage of TT power).

Hence my maximal aerobic abilities are really not a limiter (at this stage) to the ongoing development of my TT power. This helps to determine what my training focus should be for this next phase of training.

As with most cycling (except for track sprint/BMX), the focus is almost always on increasing your TT power, since it's the most import physiological marker of performance potential.

Of course rolling around the track is fun and so I will keep doing that. It also provides a safe environment for maximal sprint type efforts. Training should be hard work but it also needs to be enjoyable (mostly) otherwise we lose motivation.

So, my training will continue to be focussed on improving my sustainable TT power. Core endurance, tempo and threshold level efforts are now staples in the aerobic development diet. I'm also going to throw in a local criterium race or two as a challenge (and it's good training anyway).

My training workload is gradually increasing each week, and as I train my body is adapting to the new stress levels and responds by allowing me to continue to increase the workload. This ability to manage a continually increased workload is shown by the steady rise in the blue line in the chart below (the blue line depicts my Chronic Training Load (CTL) since I first hopped on the trainer just on four months ago).

The rate at which that blue line can rise is typically limited to a maximum of 5-8 TSS/week. Going above that rate for any length of time is usually met with an increased susceptibility for illness and possibly leads to a degrading of performance. In the opening block, I was increasing CTL at ~ 4 TSS/week and following a break from training I have been increasing at ~ 2 TSS/week. Due to the recovery from injury, it pays to be a little conservative in the rate at which CTL lifts.

Of course, for the blue line to provide such good indicator of changes in workload levels, it requires one to have an accurate understanding of their current fitness level. Hence the testing a couple of weeks ago. Not only does it set a benchmark for fitness, and provide solid data from which to determine what elements of my physiological profile need the most attention, but it also provides a sound basis on which to determine the appropriate workload and the rate at which it should be increased.

There is a period where the blue line heads south. I was having some trouble with my stump - it wasn't coping well with the stresses inside the socket and became quite sore. I thought it would need a couple of days rest but it turned out to need a lot more than that. Hence almost no training for a week and a half. It turned out that it was a technical problem that I managed to solve and so once the soreness faded, I was able to start training again and arrest that downward decline.

So far so good for the "thin blue line".

Read More......

Thursday, September 25, 2008

MAPpity doo dah, MAPpity day

I did my final of three power tests today to determine my Maximal Aerobic Power (MAP). If you want to know a bit more about what that is, just click the link.

Before we get to the result of my test, a little background Chronology:

11 Apr 07: My accident, admission to hospital emergency and multiple operations ensued.

16 May 07: Left below knee amputation.

15 Aug 07: Discharged from hospital

24 Oct 07: Collect interim prosthetic leg, begin to learn to walk again

04 Jun 08: Collect new prosthetic leg. Start to stand and walk again with comfort.

13 Jun 08: first ride on indoor trainer since accident. 15-min at 100 watts and using special short 100mm left crank arm (as my knee wouldn't bend sufficiently for a normal crank) and a flat bed pedal to rest my shoe and "foot" on.

28 Jun 08: first ride on special indoor ergo bike.

29 Jun 08: MAP Test - 246 watts

31 Jun 08: first ride using special prosthetic cycling leg attachment

11 Jul 08: first ride outdoors at Centennial Park for 45-minutes - now using a 155mm left crank

19 Jul 08: first race

21 Jul 08: now using a 165mm long left crank

22 Jul 08: MAP Test - 289 watts

26 Jul 08: second race

01 Aug 08: first ride on track

08 Aug 08: 500 metre time trial at Dunc Gray Velodrome

12 Aug 08: Some problems with stump - experiencing some pain and skin integrity issues. 10 days break from riding while I sorted this out.

13 Sep 08: now using full length cranks on all bikes (165mm on track bike, 170mm on ergo bike, 175 mm on road bikes)

21 Sep 08: trial use of poly urethane bushing under cycling cleat to aid out-of-the-saddle sprinting control

23 Sep 08: Time Trial test - 20-minute power 252 watts

25 Sep 08: MAP Test - 355 watts


What can I say, other than I am personally a little amazed. My previous best able-bodied MAP test result was 399 watts. So today I hit 89% of that. It's only 6 watts less than my MAP test from August 2006!

OK, if we want to get technical, the MAP tests this time were measured with an SRM power meter, which given it's a crank based power meter, will give ~ 2% higher reading than my Powertap, which is what my previous MAP tests were measured with (since the Powertap is a hub-based meter and drivetrain power losses are typically ~ 2%).

And for the technically minded of you, yes the SRM is calibrated and zero offsets checked and stable.

Even still, I consider it a pretty amazing result so early in my comeback.

Power chart here:

So much more work to do.....

Read More......

Tuesday, September 23, 2008

Testing Times #2

In November 2006 in this post I wrote about one method used for testing my current level of aerobic fitness - the time trial power test. It is a test to see how hard you can ride for a given distance. As a test for fitness, it's not the time taken for the course that matters so much as the average power you can sustain during the effort.

Time taken to complete the course isn't a great indicator of changes in fitness, since time can be readily affected by conditions on the day (wind conditions as an example). But power is power, provided you are conducting the test in a reasonably similar environment (altitude, terrain and it's not hideously hot or cold). It also helps to make sure you are not overly fatigued on the day of the test.

The length of the test is typically 10-miles or 16-kilometres. Doesn't need to be exact as it's power we are interested in, not the precise distance or time taken. Of course, if you ride 10-mile TTs regularly, then they are perfect opportunities to use as tests.

Today I was scheduled to do my first such test since returning to the bike.

So what happened?

Well of course today it decided to be a stormy rainy yukky sorta day, didn't it. And right now I don't need the hassle or riding in the rain.

So that left me with the other alternative - to get on the ergo bike and go for it. So that's what I did. Only trick is I have no speed/distance data on the indoor ergo bike, so I opted for a 25-minute long test.

Unsure of how hard to start with, I decided on starting at 220+ watts and then to go by feel from there. Here is the power chart from my effort (yellow = power, green = cadence):


Overall, for the 25 minutes I had an average power of 248 watts and a peak 20-minute average power of 252 watts.

So that's not too bad all things considered.

Testing continues later in week, with a Maximal Aerobic Power test.

Read More......

Friday, May 02, 2008

The seven deadly sins

This will be old hat to anyone that's been around the world of training with power meters for some time. However, having monitored the cycle training forums lately, it seems the question about how to estimate a rider's Functional Threshold Power (FTP) is something that comes up quite regularly.

So I thought I'd write a post about it in the hope that it will at least help clarify one or two things for people.

Before I go into the various methods used, it's probably worthwhile quickly revisiting what FTP is and why it is important to know.

FTP is a practical and readily measurable indicator of a rider's aerobic fitness. It was introduced to the world by Dr Andrew Coggan and for all intents and purposes it removes the confusion that exists over the term "threshold" and all of the various terms associated with it.

It is important to know FTP for a number of reasons:

-- threshold power is the single most important physiological determinant of endurance cycling performance (covering events from individual pursuits of 2 km long, up to stage racing lasting several weeks). Hence improving FTP needs to be the primary focus of our training, and measuring FTP on a regular basis is an excellent means of tracking fitness changes through the course of a season.

-- it enables a rider to define and measure intensities of riding (or power levels) relative to their own current level of fitness, expressed in a manner that relates to the primary physiological adaptation that occurs at each intensity (power) level. This is very useful for guiding training and making sure that the mix of intensity and duration during a workout or training cycle is appropriate for gaining the specific fitness required for a rider's target events.

-- it is a key input into other metrics which enable a rider/coach to monitor overall training stresses, both long term training loads and recent fatigue levels.

-- it also provides an excellent guide to how a rider should most effectively pace themselves, especially in races such as time trials (or during a breakaway in a road race or criterium)

Of course you need to have an on-bike power meter or a stationary ergometer that measures power in order to measure or estimate FTP.

FTP is simply defined as follows:

"FTP is the highest power that a rider can maintain in a quasi-steady state without fatiguing for approximately 1 hour.

When power exceeds FTP, fatigue will occur much sooner, whereas power just below FTP can be maintained considerably longer".

Okay, so that's easy. If you want to know your FTP, just go out and ride your bike as hard as you can for an hour and see what the average power was. In essence this is the gold standard measure of a rider's FTP. Unfortunately it is not always possible nor practical for everyone to do a one hour time trial like test. And not all such tests are well paced. A poorly paced effort may result in a lower average power than a well paced effort.

So what are all the alternatives available to us to estimate FTP?

Well, Dr Coggan kindly made a list of these, titled "the seven deadly sins" and posted them to the wattage forum in June 2004. Here is the original post reproduced:

"the seven deadly sins....

...er, ways of determining your
functional threshold power (roughly in order of increasing certainty):

1) from inspection of a ride file.
2) from power distribution profile from multiple rides.

3) from blood lactate measurements (better or worse, depending on how it is done).

4) based on normalized power from a hard ~1 h race.

5) using critical power testing and analysis.

6) from the power that you can routinely generate during long intervals done in training.

7) from the average power during a ~1 h TT (the best predictor of performance is performance itself).


Note the key words "hard", "routinely", and "average" in methods 4, 6 and 7..."


Okay, so #7 is obviously the "Gold Standard". What about the others?

Inspection of Ride File / Power Distribution Profile
#1 and #2 require you to inspect data using power meter data analysis software. The method is described in more detail in the book "Training and Racing with a Power Meter" by Allen and Coggan. In general these two methods are more useful as a means to check whether a rider's FTP may have changed, than for estimating FTP itself. With #2, it is important that the selection of ride files chosen contain efforts such as races or very hard training.

Blood Lactate Measurements
#3, done properly, usually requires you to visit a sports science laboratory or a well set up cycling coach's facility. Even then, interpretation of the blood lactate data may not result in practical information for the rider. If you have a power meter, there really is no need to have a blood lactate test performed.

Normalised Power (from a Hard ~1hr Race)
#4 is pretty handy, particularly as an indicator of when a rider's FTP may have changed. Frequently riders who do not do time trials, but do other races such as shorter road races or criteriums of approximately 1 hour duration, can use this as a crosscheck of their current FTP. Assuming the race was hard (that is, you were pretty much on the limit for most of the race), and you were not overly fatigued beforehand, then the 60 minute maximal Normalised Power should be at least at your FTP if not a little higher (up to about 5% higher). If your 60 minute Normalised Power is reported as more than 5% above your FTP, then that is a strong sign that your FTP needs re-setting (upwards).

Critical Power
#5 is also a very useful means of estimating FTP. It explores the relationship between work performed (kJ) and duration (seconds). Essentially all you need is at least two (or more) maximal efforts of at least three minutes and less than 30 minutes duration, say one of five minutes and another of 20 minutes, although the choice is arbitrary and up to the individual. You then enter the average power and durations ridden into the Critical Power model. The model will calculate what is called "Critical Power", which is essentially equivalent to FTP (or at least a very good estimation of FTP).

A couple of notes: the "test" rides chosen should have been performed within a reasonably close timeframe (say within the same week), and should not be cherry picked from other rides. They need to be stand-alone maximal efforts. It is also preferable to have two very good data points rather than three or more unreliable data points. I recommend reading about it here (this links to a pdf document by Eddie Monnier) and downloading the spreadsheet as well. It also helps to use the same (or very similar) durations for all future Critical Power test inputs.

Interval Training
#6 is great for riders that regularly do hard aerobic interval work, especially indoors. The intervals need to be of sufficient duration, I would say at least two efforts of 20 minutes (with a short break between) at time trial power/pace. When done on an indoor trainer, then it is common for longer maximal effort intervals of 30 to 40 minutes be nearly equivalent to FTP. As training progresses over the weeks and months, then changes in sustainable power during these intervals is a great guide to changes in FTP.


I'd suggest the Seven Deadly Sins also include the following methods:

MAP Testing
5a) by conducting a Maximal Aerobic Power (MAP) test, using the test protocol on Ric Stern's website . FTP typically falls within the range of 72%-77% of MAP.
An example of a MAP test can be viewed here.

Shorter Time Trials
5b) by conducting a time trial effort of sufficient duration (say at least 20-min), with FTP typically falling into a range of percentages for TTs of this duration e.g.:
- FTP = 93% +/- 3% of 20-minute maximal average power
- FTP = 94% +/- 3% of 16km (10-mile) TT avg power
Of course everyone is different and some may fall outside of these ranges.

There really is no reason to nail it down to the nearest watt. Setting FTP to the nearest 5 watts is sufficient. I only change the FTP setting if there is hard evidence of a change of at least 5-10W.

Of course, getting the number right does depend on ensuring that a rider's power meter is correctly calibrated and any zero offsets needed are done. Strange numbers are usually strange for a good reason.

Remember, these are all just ways of estimating FTP and some are better than others at nailing down the number (and for many, some are more practical to perform than others). The final two methods for example, would typically get you to within a few percent either side and can then be cross referenced with another method.

It all depends on a rider's circumstances. Not everyone is in the position to do a ~1 hour time trial with sufficient regularity.

What do I use?
For the purposes of tracking aerobic fitness changes, and the setting of training levels, then performing a Maximal Aerobic Power test, combined with one of the other tests for FTP (usually a 16km or 40km time trial), is the method that I typically use with my coaching clients. Having this combination is particularly useful when assessing the training priorities for an athlete.

Of course, you can always track fitness and base training levels on a mean maximal power for a duration of less than 1 hour (e.g. a 20-minute test, or as has been suggested, 2 x 8-minute test efforts). However, by doing so you start to introduce the influence of anaerobic energy production into the test result, which means you may not be entirely sure which component of your fitness is changing, and hence be uncertain as to what type of training is needed in order to progress further.

So which sin will you choose?


This isn't the end of it of course. There are still a multitude of factors to consider, such as the impact of the following on FTP:
- Environmental effects
- Point of training cycle
- Chronic Training Loads
- Training Stress Balance
- Altitude
- Hills vs Flat terrain
- Different trainer types
- Different bikes and rider positions
- Motivation

I'll save that for another post.....

References:
1. Coggan, A. Ph.D, Allen, H. Training & Racing with a Power Meter, Velopress 2006.
2. Monnier, E.
Using the Critical Power Model to Predict Various Points Along the Power-duration Curve. http://velo-fit.com/articles.htm, 2004
3.
Stern, R. What is MAP?, http://www.cyclecoach.com/pageID-news-Test_yourself.htm, 1999

Read More......

Monday, December 11, 2006

MAP Testing - where failure is a success...

So, am I getting better coach?

Well coach knows the answer already but how do you really tell? Well with a power meter, it isn't difficult to work out. Aside from actual race performances, the best guides are performance tests. These come in various shapes and sizes and generally follow a consistent protocol so that results can be compared over time. I have already described one such test I've done a number of times - the 16km (10 mile) Time Trial, which gives a really good marker of changes in aerobic fitness. See post here for an example.
Maximal Aerobic Power (MAP) is another such performance marker and can be determined with consistency through performing an incremental test to exhaustion. There are a number of protocols for these tests but they all have a common theme, i.e. you ride in such a manner where resistance (power) is continually increased until you can no longer continue. It's a bit brutal (and should only be attempted by healthy subjects) but all up it's pretty quick (less than 15 minutes).

The MAP testing protocol we use at RST is the same as used by British Cycling - and involves riding on a stationary ergometer or indoor trainer, beginning with a resistance at the lower end of endurance training levels and then increasing the resistance by 15, 20 or 25 watts per minute until you can no longer continue to sustain the power.

Different categories of athletes should use a different starting power and different incremental rate of increase in power. Where possible, the rate should be gradual, rather than in large steps of 20 or 25W/min.

Elite athletes (e.g. Cat 1 to Professional level) should use 20W/min
Non-elite men use 25W/min, and
Women use 15W/min.


The outcome we are looking for is the mean maximal power output for 1 minute, which (assuming the resistance is continually increasing) should be the average power for the final minute of the test prior to failure.
How do you do a MAP Test?

Firstly it is very important that you are healthy and reasonably fit to perform such a test. These are maximal efforts and so you should always consult your physician/doctor if in any doubt about your suitability for such testing, and most definitely if you haven't exercised for over two years, are or have been a smoker, are significantly overweight and/or are over 35 years old. Never perform a MAP test if you are ill or have been ill in recent weeks.

It helps to have an ergo trainer and a powermeter. At worst a flat road ending with a hill climb can also mimic the circumstances needed.


I perform tests by fitting the bike to a Computrainer. This is ideal as the Computrainer allows for programmable resistance increments, so it takes care of the increase in resistance for you and all you need do is focus on pedaling. But an indoor trainer where you control your own power output by watching the power meter display is certainly good enough.

It might also help to have a buddy to help keep you on track, call out the next power level and to encourage you when it gets hard. And of course, make sure you are recording the test with your power meter.

The test is relentless and you go until failure (i.e. no longer able to increase the power). You really need to try as hard as you possibly can. There ain't much more to it.
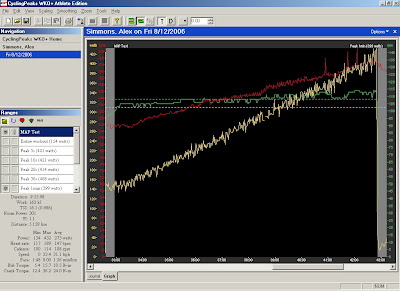
I then use the data recorded by the power meter and Cycling Peaks' WKO+ software to analyse the results.

So what does a test result look like?

Well here's a picture of the result of a MAP test I've done (click on pic to see a bigger version):


Alex's MAP Test
There are five lines on the chart. The two horizontal dashed lines show:
- Average Cadence for the test (green dashes) and
- My Functional Threshold Power (yellow dashes).
These are simply there to provide a visual reference point for the real test data.

The three jagged lines are:
- Power (yellow)
- Heart Rate (red)

- Cadence (green)


So we can see the power gradually increasing until failure. Note the mean maximal 1-minute power of 399 Watts. Darn. I was hoping I'd crack 400 this time. Never mind, there is still room for improvement there.
Heart rate is also shown for reference. A couple of spikes in the line which are likely just erroneous data. I don't use heart rate much as a guide but you should expect to see HR approaching maximum during or just after ending a test like this.

So what does it all mean?

Firstly, using this protocol, we are able to set and adjust training levels from recovery right through to anaerobic capacity efforts.

The training levels are as follows:
These can be used to help guide training efforts.

Secondly, we can measure whether training is actually improving performance.

My Map Results over last few months

Shown above are the results of my MAP tests over a period of a few months. As we can see, a 38 Watt improvement in my MAP - a little over 10% increase (and a 13% increase in terms of power to weight ratio).

So if you have a power meter and a trainer (especially one with a programmable resistance) then you have the perfect set up to test your own progress.


So what are you waiting for?

Read More......

Thursday, December 07, 2006

Testing 1, 2, 3...

About four weeks ago I wrote about one of the performance tests coach has me down for every so often - a 16 km (10 mile) time trial (or near enough to 16km). In my case I use the local training circuit - Sydney's Centennial Park and do a 4-lap TT. Well I just did another one of these on Tueday this week.

Ease Up!
In the lead up over last few weeks, my training was eased back a little, partly to give my body a chance to catch up with the CTL I had accumulated and in response to a few early signs of fatigue (like being unable to complete a set interval) but also a chance to have a race or two with a little freshness. Now I was by no means overtrained, not even close, and race power outputs have certainly been healthy enough. It also represents a segue into the next phase of training, where intensity of workouts really starts to pick up for the build towards the track championships next March.

So what's the Performance Manager telling us? Well this is an extension to the chart I last posted here on 23 October.

My lastest PMC

So since last time, we see CTL continue to build through to mid-November, reaching a peak of 98 TSS/day on 12 Nov (which is an all time peak CTL for me - last season my CTL peaked at 81 TSS/day). After that you can see the impact of my training easing back, with CTL dropping, going TSB positive and enjoying some good form at the track carnival up at Gosford.

And the test TT? Well here's the chart of the ride. Stats are shown on the left, with wattages by lap also indicated.

16km TT test

Pacing TTs well is a challenge for me. Let's face it - I don't do lots of TTs so my pacing is a less than fine tuned skill but I'm sure I'll get better with more practice. I'm a track/crit rider, used to the dynamics of that environment.

Last time I tested (1 Nov) I talked about how I picked it up a little mid-way, then paid the price in the final lap. Well this time I started slightly more conservatively (~5W less) than last time but found that the last lap and a half I was able to crank it up considerably. So in the end I averaged only 1 Watt higher than last test.


While it's not much of a PB (it's still a PB!), I am pretty happy with that as I had all the "mental sensations" of actually losing some aerobic fitness this last couple of weeks, so personally I wouldn't have been surprised to have struggled more than I did.
I suspect coach knows more than I do though....
Soft c**ks
Last weekend I was supposed to have a race but I turned up and found they'd decided to cancel since all these softies in Sydney go underground at the slightest hint of wet weather. So bugger it, I got on my bike and did some hard laps anyway. After eight circuits at Heffron I got a bit bored, eashed back for a short time then two other guys came through doing turns so I jumped in with them and we cranked it up for a few more good laps. So a neat little 50 minute effort. Then the rain came.

My MAP test is tomorrow and this weekend I race the Brindabella Challenge crit. Will report in next week.

Read More......

Tuesday, November 21, 2006

Trials and tribulations

Well, more trial than tribulation.....

Here I am in pursuit mode
(this one's from the team pursuit titles earlier this year)
Last night I was scheduled to ride a trial individual pursuit - to set an early benchmark as I progress towards State & National Masters track champs in March. For me this means a 3,000 metre effort from a standing start on a velodrome. Fortunately I have good access to a world class indoor facility - the Dunc Gray Velodrome. And given that, along with John "JB" Beatty, I supervise the Monday night track training at DGV, I pulled coach's privilege and had a ride myself.
The individual pursuit is a funny event - it plays with your mind. But that's a whole other story.
So after a warm up I get the track to myself and decide on a schedule to ride a 3min 50 sec time.

Here's the result:

The power and speed graph from my trial pursuit last night.

And the numbers:
Pursuit Trial:
Duration: 3:14
Distance: 2.496 km_________Min_____Max_____Avg
Power:___346_____892_____433 watts
Speed:___8.3____48.5____46.2 kph
Temp:_____________________24 C
Air P:__________________1016 hPa
Cruise speed:_____________47 kph
Gear:___________49x14 (94.5")
Cadence at cruise________107 rpm
CTL:____________________93.4
TSB:___________________ +1.5


The more astute reader will notice I pulled the pin with 2 laps to go. Maybe that was the wrong thing to do but it was the decision I made on the spot - I just wasn't ready to dig a big hole for myself. I was going slower by that stage and speed wasn't great to start with.

An all time 3 min power PB though. By quite some margin so the training on the engine is working fine.
Hmmm. Don't really understand the slow speed for such power?

I started out pretty conservatively for me, peak power under 900 Watts and I didn't overshoot the target speed by much (if at all). So all I can conclude is that I need to work more on the aero position. I have a new frame in mind which will provide a far greater opportunity to improve my aerodynamics. On my current rig I am using a Look Ergo stem and it is just about already at full downward tilt. I'll just keep playing with it.

'til next time....

Next weekend is the Central Coast track open. Should be a hoot.

Read More......

Wednesday, November 01, 2006

Testing Times

Well today was one of my regularly scheduled fitness tests – the 16km (10 mile) Time Trial effort. I’m not so much interested in the time it takes to complete the course as I am in the average power output for the duration of the effort.

If my fitness has improved (and I’m not too fatigued), then I should put out more power on average than I did last time I tested. It’s a much better gauge of progress than a stopwatch, especially on this day as conditions were quite different.

Regular testing is a really important part of any training programme - firstly it helps determine what your current capabilities are (as measured by average power output over a given duration or distance). That knowledge is then used to shape training plans suitable to improve the capabilities specific to your target event or cycling goal. Finally tests ensure that training is having the desired physiological impact. Adjustments to training can then be made according to results. Besides, tests are great workouts in themselves, so they should be part of any regular training cycle.


Well first let’s get the excuses out of the way…

This week we moved to summertime in Sydney, so the clocks have just gone forward an hour. My mid-week workouts are early morning, so getting up at 5am was really getting up at 4am… I’m not sure the body was quite adapted to surfing the pain curve quite so early in the morning. Then there was this strongish westerly blowing in (an unusual breeze that one) and that was going to make pacing a challenge on the circuit I use. Then in the warm up I’m thinking, why does it sting when I’m not really going that hard?
Oh just shut up and get on with it….

Anyway, with that lot out of the way, we get into the test. But how hard do I go? Well a couple of weeks ago I set a new 20 minute mean maximal power (MMP*) PB in a criterium race at Olympic Park. So I figure, that’s what I’ll aim for. Nothin’ but the best for me!

Ay yay yay! That hurt! In the course of a 4 x 4km laps I rode laps 1 & 2 at around the nominated power, then for some unknown reason I have visions that I can or need to go harder (surely I can go harder?), so I do and lap 3 is cranking (and hurting). Lap 4 was ugly.
Result

Well I beat my last test average power by about 10 Watts and set a new 20 minute MMP PB in the process! So there you go. Not so bad after all. Did I say lap 4 was ugly? Yep, it sure was ugly. I was definitely hurting more today that last time though… or maybe the pain memory of my last test has simply subsided.

Oh, and this is a 46 Watt improvement over my first test in August.
Test day stats:
CTL: 93
TSB: -8 (so reasonably neutral but on RPE it felt more like –15 or so)
And why is it that on power test days you swear the Power Meter reads low?

Here's a pic of the test results (click on pic to enlarge). Note how variable the speed was compared to power. This was partly the slightly up n down nature of the loop I was using but also the wind which was creating a pacing challenge. See the ugly last lap?

Dashed horizontal lines mark average power (yellow) and average speed (blue) for the course.

*MMP – the highest average power output for the nominated period within a ride (e.g. the best average 20 minute power within a 2 hour ride). Often shortened to 20min MMP, 60 min MMP, 5 sec MMP etc.

Why 20 minute power?

Well it’s a fairly common marker of aerobic fitness and is a duration that is readily repeatable either in normal training or regular testing, especially where 60 minute efforts are less frequently undertaken.

Read More......