Showing posts with label Time trial. Show all posts

Saturday, May 31, 2014

Swings and Roundabouts

Today I thought I'd look at how rider's relative abilities play out in Grand Tour stage racing. I was prompted to do so after watching this year's Giro d'Italia's Stage 19 mountain individual time trial.

It's no surprise that to be competitive on general classification (GC) in a grand tour requires, amongst a variety of traits, phenomenal physiological capabilities, and each rider has their strengths and weaknesses relative to their opponents. Clearly climbing ability is a key factor in success, but also a rider's ability in individual time trials (ITT) is also an important factor for success.

Success in the ITT, is more suited to those riders with the highest sustainable power to aerodynamic drag ratio (power to CdA, W/m^2), while climbing steeper gradients a rider's sustainable power to weight ratio (W/kg) is the dominant factor for success.

Some riders are a bit larger and have more power and are relatively more aerodynamically shaped and set up, while others have better power to weight ratios. If you can nearly equal your opponents in one discipline and beat them in the other, then you're well on your way to GC success.

The balance between these two key attributes does vary from race to race as grand tours vary the total number and distance of ITTs, and the number of mountain top finishes. While total metres climbed during a grand tour is a factor for overall fatigue levels, it's the summit finishes and individual time trials that account for the majority of time gained and lost between leading contenders, and these are the critical stages for GC riders.

As an example of this game of physical swings and roundabouts, note the differences in make up of race defining stages in recent editions of the Tour de France:


We can see that the 2012 TdF was far more suited to TT ability than it was for climbing ability, but this year is more weighted towards the climbers. Of course you can't badly falter in either discipline, but 2012 was never one for a pure lightweight climber.

In this 2014 edition of the Giro d'Italia, there have been three time trials: a team time trial, an individual time trial over flat/lumpy terrain and an individual time trial (MTT) up a mountain. There are also 5 high mountain summit finishes. So while ITT performance is important, it was always going to be a rider's climbing prowess and their power to weight ratio that dominated this Giro.

What is interesting with this race though was the inclusion of the MTT, giving us a chance to directly compare riders' flatter ITT and MTT performances.

Both the individual TTs arrived fairly deep into the contest, with the ITT on stage 12 and the MTT on stage 19. I thought it interesting to plot the relative performance of the top GC riders in each of the time trials (click on the pic to see a bigger version). I chose the top 25 on GC (after Stage 19's MTT) as these are the riders more likely to be actually competing on such stages, rather than holding back somewhat to save the legs as much as possible for other duties or race ambitions.


The dots represents each of the top 25 riders on GC after Giro Stage 19. The top 10 riders are highlighted with red dots and text.

The rider's time for the Stage 12 ITT is plotted on the horizontal axis versus their time in the Stage 19 MTT on the vertical axis. e.g. we can see Uran's time in the ITT was a bit over 57:30, and in the MTT a little over 1:07.

When plotted this way we can see whether riders fared relatively better in the flatter ITT, the MTT, or if they performed relatively similarly in each. Of course the further a rider's dot appears to the bottom left indicates faster TT times overall.

The further away the rider's dot is from the diagonal line indicates a dominance of either the ITT (upper left) or the MTT (lower right). If their dot appears close to the diagonal, it indicates their relative performance for the two time trials was balanced.

Those in the upper/left side of the chart are more skewed to perform better in flatter ITTs, and hence their power to aero drag ratio is relatively better than their power to weight ratio, while those in the bottom right side of the chart performed relatively better in the MTT and so their power to weight ratio is relatively better than their power to aero drag ratio.

This Giro is clearly one for the climbers over the TT men given there is an MTT and 5 high mountain summit finishes, and only one (not totally flat) ITT and one TTT.

The balance between each of these two key attributes will play a factor in a rider's likely chances of success in any grand tour and which side of that balance is more dominant depends in large part to the make up of the critical stages. It also points out what element of performance a rider may need to look at in order to improve their overall standing relative to their opponents.

Looking at the chart, there are some riders that would do well to refine their ITT performance, something that's more possible to address with a focus on aerodynamics. Losing weight and gaining power is much harder for a top Grand Tour GC rider to (legally) achieve.

Aru, Rolland and of course Quintana will be dominant riders for the future if they are able to improve their power to aero drag ratio. Of these three, I'd say Rolland and Quintana have the most to gain from aero refinements.

Pierre Rolland
image: velonews.competitor.com
Fabio Aru
image: www.gettyimages.com
Nairo Quintana
image: www.gettyimages.com


Read More......

Sunday, August 30, 2009

Testing is Training....

One of the Pithy Power Proverbs is "Training is testing, testing is training." by Andy Coggan. It's really a way of saying that one shouldn't be afraid of "mucking up their training" in order to schedule a performance test, since by their very nature, tests are very high quality training efforts anyway.

Many think that one needs to taper or rest up significantly for such tests and that's what "mucks up your training". Well yes and no. A lot depends on where you are at in your training.

Certainly at lower Chronic Training Levels (less than ~70-80 TSS/day), then a significant rest up really isn't necessary. Sure, don't go and smash yourself the day before hand but not too much more concern should be had with resting up. At high CTLs then perhaps a little more recovery time is in order before tests.

So over the past couple of weeks I have been doing some testing. Coach Ric figured it was time we checked under the hood to see whether I was running a 2 pot screamer, a Wankel rotary, a turbo 4, the family 6 or a big donk of a V8.

Before I get to how that panned out, here's a quick summary of my training over the past 7.5 weeks in the form of a Performance Manager Chart:


You can see that following a break after the National (Apr-09) and Oceania (May-09) Paralympic road race championships, my CTL had fallen significantly (was at ~ 70 CTL at time of the champs). I had expected it to drop a bit as I was taking a week off and then some easy riding but a series of events led to quite a long interruption to my training of about 8 weeks. Initially I had problems with my new walking prosthetic and after that was finally sorted and I rode again for a couple of weeks, I took then ill for a while with some weirdo viral bug. So CTL dropped to ~ 32 TSS/day with lots of time off the bike.

OK, so once I was healthy enough to train and had my prosthetic sorted, it was time to ramp it back up again. In the period leading up to testing my CTL was rising at a little over 6 TSS/day per week, which you can see by that steady upward march of the blue CTL line in the chart above.

So after that five week block of training, I had a week with a 16km time trial (TT) scheduled for a Tuesday and a Maximal Aerobic Power (MAP) test on the Thursday. Those days are shown on the chart above.

Here's the power trace from the 16km TT:


Well it's actually a bit shorter than 16km at 15.3km. Four laps of Sydney's Centennial Park (a gradually undulating course) but it's close enough for the purpose and is a testing ground I have used many times. I did the TT on my road bike (no TT rig at the moment).

299 watts for 24:29 (37.4 km/h)
Peak 20-min: 301W
CTL: 69
TSB: -31

That's 92% of my pre-injury PB power (326W) on the same course.

Testing Part II was the MAP test on the Thursday. Here's the result:

MAP is the maximal 1-minute average power from a ramp test to exhaustion using a ramp rate of 20 or 25W/min (depending on category of rider). I use a 25W/min ramp protocol.

MAP: 410 watts
CTL: 70.6 TSS/day
TSB: -25.2

That's an all time PB MAP result for me and is 103% of my pre-injury PB (399W).

Note the Training Stress Balance (TSB) at the time of both tests - both what I would call significantly negative (meaning I was quite fatigued), yet I still produced post-accident PB power levels and in the case of my MAP, well I'm a little astounded at setting an all time best just 14 months after I tried to pedal on a bike again for the first time since my accident.

So astounded was I on the day that I decided to make a special effort to re-check the slope calibration of the SRM power meter on my ergo bike. It was slightly off and my numbers were lowered by 4W (initially I had 414W).

Here's a look at my previous MAP test results over the past two and a bit years. Also marked are the months where I had my accident and amputation, as well as when I started back on the home trainer:


One can wonder - was I fully developed as an athlete beforehand? Has that skewed the results?

Well probably not fully developed (I sure had plans of becoming more powerful), but I wasn't un- or under-developed either. I had an FTP well over 300W and a CTL of the order of 100 TSS/day. Up to that point I had attained podium in 6 team pursuit championships including a championship win in state record time, 1 x podium at teams time trial championships, 1 x podium at criterium championships as well as an open criterium win, and a podium at the national masters track points race champsionships (right before my accident).

Now I don't know what specific conclusions you can draw from this n=1 study, but as an athlete who has severals years of power meter data prior to and after a lower leg amputation I think it will no doubt be of interest to those who study the performance implications for such injuries and the use of prosthetics in cycling. Clearly there are many high performing athletes using similar prosthetics.


One outcome of testing is to establish or validate an estimate for Functional Threshold (~1-hour TT) Power (FTP) . On the basis of these tests (the TT in particular and my recent longer threshold tolerance intervals), I have reset my FTP to 280 watts as of the day of the TT. It was previously set at 270 watts.

So what now? Well one thing to note is the ratio of FTP to MAP.

Currently that puts me at a ratio of 280W / 410W = 68%
My previous best pre-injury I was 315W / 399W = 79%

That's quite a remarkable difference in the ratios and I'm not entirely sure of the reason.

Typically the ratio of FTP to MAP is in the range of 72% - 77%, so on both accounts I fall outside the typical range (it happens). Pre-accident I was always somewhere around the upper end of the range. Everyone's ratio is different and can vary through the course of training and be due to your physiological and power profile (anaerobic capacity, VO2max, % of VO2max one can sustain at threshold and so on).

One way to think of it is MAP is like your aerobic ceiling* and FTP is how close to that ceiling you are able to get when riding a TT. So in this sense, it suggests that my roof is plenty high and that I have lots of room to further improve my TT power before I starting bumping my head. Which is good!

* of course there is an anaerobic component to MAP as well (as indeed there is in shorter TTs albeit a smaller overall contributor to total energy output) but examination of hundreds, if not thousands, of MAP tests have shown it to be a reliable indicator of aerobic performance potential.

My testing isn't actually finished. Since I will be targeting the 3km and 4km individual pursuit (and track TT 750m and kilometre) over the next 6 months we have also scheduled a trial 3km pursuit effort for this coming week. That'll be fun.

Read More......

Sunday, April 05, 2009

New Skool

OK, a follow up to this earlier post ("Old Skool") about a local time trial (TT) I raced last month on my normal road bike.

On that ride I completed the not quite 25km undulating Calga TT course in 42:55.

I also referred to the importance of the 3 P's of riding fast TTs (well as fast as one can go):

1. Power to the pedals
2. Piercing the wind
3. Pacing the course

With power meter data, the environmental conditions known and some special mathematical wizardry, I am able to quantify each of those three Ps from my ride last month:

1. Power:
My power average was 264 watts (normalised power 268 watts).

2. Piercing the wind:
I estimated a Coefficient of Drag x Frontal Area (CdA) of 0.334 m^2. The lower the CdA, the faster you go for the same power output.

3. Pacing
My Pacing Optimisation Score was 0.990, which ranks between "excellent" and "best in class" and means that in order to attain "best in class" level of pacing, there was another ~ 13 seconds of time savings to be found on course. Those savings can be found by dosing your effort carefully on the course depending on the terrain.

Of these 3 P's, the biggest gains (in a month) were going to come from improving #2: Piercing the Wind.

My pacing is already pretty good (but always room for improvement).

As for power, well that was a bit of an unknown for a couple of reasons, one of which I'll get to in a moment. The other reason was I recently had a bad head cold and needed a full week off training. That's never a good thing when you are training well to improve your power. If you have a good amount of training behind you, it often doesn't hurt your power much, provided you allow yourself to recover properly and don't start riding hard too soon and end up prolonging the illness.

So what about piercing the wind?

After my Old Skool post, a generous offer was made by a former coaching client of mine to loan me a TT specific bike (for a while until I can sort out my own rig). That was an offer too good to refuse, so last week the bike arrived and yesterday was my first and only chance to work on getting the set up right. It even has a Powertap power meter so that was a big bonus :D.

So it was off to Centennial Park for some time riding and making adjustments to the saddle position, the bars, arm rests and so on until I felt I could ride the bike OK. Main challenge was being able to pedal without the prosthetic hitting my arm on the upstroke. It's really annoying. I got it to a stage where it was hitting slightly but not enough to ruin a ride. I will have a solution for that, which I'll write about in another post (some news coming about my new legs).

Sometimes when you go from a road bike position to a TT bike position you can lose some power as you are not used to the different joint angles and so on. Typically you are looking to maximise your aerodynamic gains without much sacrifice in ability to produce power (in the end it's maximising speed that matters). That can take quite some time to optimise as you need time to adapt to the new bike position. I didn't have that luxury as the TT was today.

Here's the loaner bike:


Bike has an aero bar set up and 38mm deep carbon rims, so not a complete aero set up (which would have a rear disk wheel and a deep section front wheel). Also, I am not as yet using an aero helmet - I used the same standard road helmet as last time as well as a skin suit.


So what happened this time?

Conditions today were very similar to last time: calm to very little wind with the same air density at 1.179 kg/m^3 (different temperature, barometric air pressure and humidity between each day but all the variations cancelled each other out to end up with air that was the same density). In other words, the two TTs can be readily compared.

My race time was 41:14, which is 1 minute 41 seconds faster than last month.

So how did the 3 P's compare to last time? Here are the numbers (with previous month's TT numbers in brackets). They allow us to assess how much each component of the Three Ps contributed to my extra speed.

1. Power:
Average: 263 watts (264 watts) - basically the same power
Normalised: 269 watts (268 watts)

2. Piercing the wind:
CdA: 0.286 m^2 (0.334 m^2) - a 14% improvement

3. Pacing the course:
Pacing Score 0.991 (0.990)
Time lost compared to Best in Class pacing: 8 seconds (13 seconds) - so a 5 second improvement through better pacing


So it's pretty clear that the vast bulk of speed improvement was due to my improved aerodynamics, all achieved simply because I was using a bike that enabled me to ride in a much more aerodynamic position. Now if you ever wondered why some riders obsess over aerodynamics - well there's your answer!

Just to put the aerodynamic changes into perspective,
that's over 4 seconds per kilometre faster for the same power.

The nice thing about this is that there are more aerodynamic improvements to be made, and one would hope that my fitness will improve and that I'll have more power available once I adapt to the TT position. As for pacing, well I seem to have that pretty well sorted.

One final comment on the day. Last time I experienced some problems with my leg fitting becoming loose and painful in the latter stages of the TT. I didn't experience the same problem today. I packed extra foam into my leg this time and conditions were a little cooler which more than likely meant less sweat build up inside the leg liner. It still works loose gradually over time but it was much better today and no significant pain.

My next TT will be at the end of April, when I tackle the challenging Mooball TT course in northern NSW. That is part of the 2009 National Paracycling Road Race Championships. Should be a hoot (although I wish it were a flatter course).

Read More......

Sunday, March 08, 2009

Old Skool

Time trialling is a popular part of the sport of cycle racing. The "race of truth" is deceptively simple. Ride a set course by yourself and try to finish it in the shortest time possible. Fastest time wins. Easy.

As always with this sport, there are a number of elements that go into riding the fastest time you can. But in essence, they come down to the three P's:

1. Power to the pedals
2. Piercing the wind
3. Pacing the course

If you don't address all three "P's", you are riding sub-optimally from a "least time" perspective.

Power is all about the training you do to improve your fitness and your ability to ride harder. The power and training part of the equation is something I've written lots about on this blog.

Piercing the wind is all about the aerodynamics of your bike and especially your position on the bike. Given this is about the physical elements that resist our forward motion, I also include a few other items, like having the best tyres for the lowest rolling resistance and an efficient drivetrain so power is not "lost" between the cranks and the rear wheel.

Pacing is the skill part of the equation and is all about knowing how hard to push yourself at various times on the course. Pacing is something I've also written quite a bit about (but not here on my blog), and for which I have developed some mathematical modelling. I'll write a bit here about that one day.


Anyway, what's all this fancy pants maths got to do with "Old Skool"?

Well last weekend I rode a TT. It's our "local" TT run by the NSW branch of the Australian Time Trials Associations (ATTA) which is held on the first Sunday each month on the Calga course, about an hour's drive north of Sydney.

I decided to get back to doing some TTs for a few reasons. Firstly, since they are a race against the clock, once you have set a time then you have a benchmark for improvements. In essence you are racing only against yourself. They are an excellent fitness marker, especially when you are measuring your power output.

Secondly, I have also decided to race the paracycling national road championships (late April-early May), which includes a road TT (and a road race). So getting some similar length TTs under my belt seems like a good idea.

Finally, as I keep on with my return to the bike, I need to rediscover the type of competitive outlets that will better suit my new "body". So going back to riding many different types of events is one way to re-learn all about that.

Anyone who's ridden a TT, or even just watched one, will know that many riders use special bikes which are designed to improve the aerodynamics of the rider and bicycle. Much thought goes into this as it can result in big savings in time for the same physical effort.

However, some riders decide to ride TTs "Old Skool" style, meaning they use a standard road bike with standard wheels and helmet. No special effort is made to improve aerodynamics. That's what I did last week.

For some fun, below is the graphical summary of my ride and pacing analysis.


There's a bunch of stuff on there I won't go into today but in essence it shows the course elevation profile (it's an out and back course, with the first half mostly climbing) with elevation data obtained via two methods I won't describe here now, and two lines showing power - the yellow line is my actual power output (a 40-second rolling average) and the green line is a theoretical optimal power output for that segment of the course. By comparing the two lines you can see how well or otherwise I dosed out my effort along the way. So thats the Power and the Pacing elements.

There are also a range of other numbers shown, one of which is an estimate of my Coefficient of Aerodynamic Drag and Effective Frontal Area (CdA), which is a measure of how well (or not) I slice through the wind. Thats the "Piercing the wind" element.


OK, so how did I go?

Time: 42:55 @ 35km/h.
Average Power: 264 watts
Normalised Power: 268 watts

Not too bad given it was on standard road bike, helmet and wheels and the constantly up 'n' down Calga course. That placed me 25th out of 45 riders.

I was hoping for more like 270-280W (my first 20-min were at an average of 277W and holding myself in check) but I struggled with my prosthetic leg getting loose after about 15-20 minutes which saw 2nd half power fall somewhat and quite a bit of stump pain in the latter stages. My stump was very sore afterwards.

But that was exactly the point of the exercise - to find out the issues I face and need to fix when doing this sort of an effort. On a course like Calga, which is never flat and the power is somewhat more variable as a result, then the leg does tend to work loose a bit more quickly than say on a flatter road or on the ergobike where the effort is far steadier.

Main thing is to work on a solution for keeping my leg packed firmly in the socket during a longer hard effort. Otherwise it hurts and more importantly, you lose power. Maybe I needed to use more foam packing (which is what I'm doing at the moment). I probably didn't put enough in. Then there is the socket itself, which my rehab doc and prosthetics specialist says no longer fits properly (I have lost weight and my stump has changed its shape and volume again).

Of course I am also getting a special cycling leg made up, thanks to the generous donations and fund raising by the track cycling community here in Sydney. That is now being planned. I have the appointment to recast my stump on 2nd of April and from there we can begin the production of a new leg socket and a new general purpose leg. I can hardly wait!

So at the Calga TT next month I may be able to borrow a TT bike and see what difference it can make to my time. The analysis above shows a CdA of 0.33m^2 (square metres), which is very high for anyone doing a TT. Certainly riding on a TT bike I would expect that number to be much lower. Even at a modest 0.28m^2 (certainly readily attainable on a TT set up) I could expect to ride that same course in the same conditions (wind, temperature & air pressure) at the same power about 2-minutes faster.

We'll see.

Read More......

Sunday, December 21, 2008

Swiss Watch

"The body responds like a Swiss watch. You just have to figure out how to wind it." - Dave Harris

OK, alright, I got a complaint about my blog. Like, "you haven't posted anything for ages!". Well it's been twenty days to be precise, but who's counting?

I've just been busy with quite a few things, so I'll try a catch up with this post.

Since my benefit night, training has continued along very nicely. In the first three weeks of December I have accumulated a little over 21 hours of riding and 1457 TSS with an average Intensity Factor of 0.83. That means that those hours, on average, were ridden at a level of exertion of 83% of my estimated 1-hour maximal (threshold) power.

Which is a technical way of saying very little training time has been wasted, and all efforts have been quality. Training has basically been a mixture of core endurance rides, solid tempo efforts, threshold tolerance intervals along with some track sprint work.

Here is a pic of the "thin blue line" to date:


Again, you can see the steady progression of the chronic training load (blue line) indicating the continual progressive increase in load/stress being placed on my body. The leg has been holding up well to the increase in workload and the body is also continuing to adapt. How well is it coping though?

Last week I was scheduled to do some performance tests, one a time trial effort of around 16km (10-miles) and the other a Maximal Aerobic Power (MAP) test. While not a formal test, I have also been doing some sprint work at the track to see how my maximal (neuromuscular) power is going.

First up was my time trial at Centennial Park. Here's the power file chart:


An average power of 287 watts over 26 minutes. So TT power is up 39 watts (nearly 16%) on the test I did on 23 September.

I sometimes surprise even myself. That's 9 watts more than same test/venue (albeit on a cold day) on 8 Aug 2006. I was a few kg lighter back then though. For reference, my best power on that course is 328W (and at a lighter body mass as well).

I followed that up with the MAP test on Friday, riding Thunderbird 7 (my indoor trainer bike). Here's the graph:


My MAP was 385 watts (mean maximal 1-minute power during the test). Yikes! That's up 30W (8.5%) on my last MAP test on 25 September.

What's even scarier is that's only 14W shy of my best ever MAP of 399W (as measured by Powertap on a Computrainer). Allowing for some drivetrain power losses for recording with Powertap vs SRM, that still means my MAP has attained nearly 95% of pre-accident levels. That is pretty remarkable under the circumstances. It's only six months since I put the bike into a home trainer and tried to pedal.

What about my sprints?

Well for a couple of Sundays now I have gone to my local track for some sprint work. I am now getting peak power > 1200W on several occasions. Pre-accident, I would regularly be ~ 1350W and occasionally up to 1400W. So sprint power is not too bad either.

So my body is indeed a Swiss Watch. It seems that coach has worked out how to wind it quite nicely!

Of course one of the consequences of that testing is my estimated Functional Threshold Power has gone up from 240W to 275W. Since my daily training stress is calculated relative to FTP, it means that rides have to be at a higher power now to earn the same Training Stress Score.

As they say, it doesn't get easier, you just go faster.

This morning I woke late, and then checked what was on the program today. 2.5hrs, that's what! Holy smoke! OK, so I saddle up, head out the front door and get into it doing a run to Kurnell, being my first proper solo run back out there in the world of Sydney's roads.

A little over 2.5 hours ride time later I get home, with two short stops along the way to remove, dry and replace my leg liner which seems to accumulate the contents of Sydney Harbour while I'm riding.

Average Power: 186W
Normalised Power: 198W
TSS: 130
Distance: 71.4 km

Ironically, I came home via "that gate". It was definitely open when I rode through.

One last thing - I have chatted to my prosthetics specialist George and we will hook up again in the new year to start looking at the design and construction of a leg dedicated to cycling. Picking the right time for that is tricky, as since I am now trimming down, that affects the fit of my stump in the socket. So getting the leg too early might reduce its useful life.

I did however use some of the funds raised to purchase a new leg liner (or as Paul Craft calls it, the big blue condom that goes over my leg) and distal cup (the current cup is looking a bit worse for wear). That was $1300, so the benefit funds are already being put to good effect. I'll now be able to rotate the liners and hopefully get a bit more useful life out of them. Early in the New Year, I'll probably add a third liner to the stable.

So there you have the latest. All going well as far as training goes. More hard work ahead of me though, and probably a few races over the next month.

Read More......

Tuesday, September 23, 2008

Testing Times #2

In November 2006 in this post I wrote about one method used for testing my current level of aerobic fitness - the time trial power test. It is a test to see how hard you can ride for a given distance. As a test for fitness, it's not the time taken for the course that matters so much as the average power you can sustain during the effort.

Time taken to complete the course isn't a great indicator of changes in fitness, since time can be readily affected by conditions on the day (wind conditions as an example). But power is power, provided you are conducting the test in a reasonably similar environment (altitude, terrain and it's not hideously hot or cold). It also helps to make sure you are not overly fatigued on the day of the test.

The length of the test is typically 10-miles or 16-kilometres. Doesn't need to be exact as it's power we are interested in, not the precise distance or time taken. Of course, if you ride 10-mile TTs regularly, then they are perfect opportunities to use as tests.

Today I was scheduled to do my first such test since returning to the bike.

So what happened?

Well of course today it decided to be a stormy rainy yukky sorta day, didn't it. And right now I don't need the hassle or riding in the rain.

So that left me with the other alternative - to get on the ergo bike and go for it. So that's what I did. Only trick is I have no speed/distance data on the indoor ergo bike, so I opted for a 25-minute long test.

Unsure of how hard to start with, I decided on starting at 220+ watts and then to go by feel from there. Here is the power chart from my effort (yellow = power, green = cadence):


Overall, for the 25 minutes I had an average power of 248 watts and a peak 20-minute average power of 252 watts.

So that's not too bad all things considered.

Testing continues later in week, with a Maximal Aerobic Power test.

Read More......

Friday, May 02, 2008

The seven deadly sins

This will be old hat to anyone that's been around the world of training with power meters for some time. However, having monitored the cycle training forums lately, it seems the question about how to estimate a rider's Functional Threshold Power (FTP) is something that comes up quite regularly.

So I thought I'd write a post about it in the hope that it will at least help clarify one or two things for people.

Before I go into the various methods used, it's probably worthwhile quickly revisiting what FTP is and why it is important to know.

FTP is a practical and readily measurable indicator of a rider's aerobic fitness. It was introduced to the world by Dr Andrew Coggan and for all intents and purposes it removes the confusion that exists over the term "threshold" and all of the various terms associated with it.

It is important to know FTP for a number of reasons:

-- threshold power is the single most important physiological determinant of endurance cycling performance (covering events from individual pursuits of 2 km long, up to stage racing lasting several weeks). Hence improving FTP needs to be the primary focus of our training, and measuring FTP on a regular basis is an excellent means of tracking fitness changes through the course of a season.

-- it enables a rider to define and measure intensities of riding (or power levels) relative to their own current level of fitness, expressed in a manner that relates to the primary physiological adaptation that occurs at each intensity (power) level. This is very useful for guiding training and making sure that the mix of intensity and duration during a workout or training cycle is appropriate for gaining the specific fitness required for a rider's target events.

-- it is a key input into other metrics which enable a rider/coach to monitor overall training stresses, both long term training loads and recent fatigue levels.

-- it also provides an excellent guide to how a rider should most effectively pace themselves, especially in races such as time trials (or during a breakaway in a road race or criterium)

Of course you need to have an on-bike power meter or a stationary ergometer that measures power in order to measure or estimate FTP.

FTP is simply defined as follows:

"FTP is the highest power that a rider can maintain in a quasi-steady state without fatiguing for approximately 1 hour.

When power exceeds FTP, fatigue will occur much sooner, whereas power just below FTP can be maintained considerably longer".

Okay, so that's easy. If you want to know your FTP, just go out and ride your bike as hard as you can for an hour and see what the average power was. In essence this is the gold standard measure of a rider's FTP. Unfortunately it is not always possible nor practical for everyone to do a one hour time trial like test. And not all such tests are well paced. A poorly paced effort may result in a lower average power than a well paced effort.

So what are all the alternatives available to us to estimate FTP?

Well, Dr Coggan kindly made a list of these, titled "the seven deadly sins" and posted them to the wattage forum in June 2004. Here is the original post reproduced:

"the seven deadly sins....

...er, ways of determining your
functional threshold power (roughly in order of increasing certainty):

1) from inspection of a ride file.
2) from power distribution profile from multiple rides.

3) from blood lactate measurements (better or worse, depending on how it is done).

4) based on normalized power from a hard ~1 h race.

5) using critical power testing and analysis.

6) from the power that you can routinely generate during long intervals done in training.

7) from the average power during a ~1 h TT (the best predictor of performance is performance itself).


Note the key words "hard", "routinely", and "average" in methods 4, 6 and 7..."


Okay, so #7 is obviously the "Gold Standard". What about the others?

Inspection of Ride File / Power Distribution Profile
#1 and #2 require you to inspect data using power meter data analysis software. The method is described in more detail in the book "Training and Racing with a Power Meter" by Allen and Coggan. In general these two methods are more useful as a means to check whether a rider's FTP may have changed, than for estimating FTP itself. With #2, it is important that the selection of ride files chosen contain efforts such as races or very hard training.

Blood Lactate Measurements
#3, done properly, usually requires you to visit a sports science laboratory or a well set up cycling coach's facility. Even then, interpretation of the blood lactate data may not result in practical information for the rider. If you have a power meter, there really is no need to have a blood lactate test performed.

Normalised Power (from a Hard ~1hr Race)
#4 is pretty handy, particularly as an indicator of when a rider's FTP may have changed. Frequently riders who do not do time trials, but do other races such as shorter road races or criteriums of approximately 1 hour duration, can use this as a crosscheck of their current FTP. Assuming the race was hard (that is, you were pretty much on the limit for most of the race), and you were not overly fatigued beforehand, then the 60 minute maximal Normalised Power should be at least at your FTP if not a little higher (up to about 5% higher). If your 60 minute Normalised Power is reported as more than 5% above your FTP, then that is a strong sign that your FTP needs re-setting (upwards).

Critical Power
#5 is also a very useful means of estimating FTP. It explores the relationship between work performed (kJ) and duration (seconds). Essentially all you need is at least two (or more) maximal efforts of at least three minutes and less than 30 minutes duration, say one of five minutes and another of 20 minutes, although the choice is arbitrary and up to the individual. You then enter the average power and durations ridden into the Critical Power model. The model will calculate what is called "Critical Power", which is essentially equivalent to FTP (or at least a very good estimation of FTP).

A couple of notes: the "test" rides chosen should have been performed within a reasonably close timeframe (say within the same week), and should not be cherry picked from other rides. They need to be stand-alone maximal efforts. It is also preferable to have two very good data points rather than three or more unreliable data points. I recommend reading about it here (this links to a pdf document by Eddie Monnier) and downloading the spreadsheet as well. It also helps to use the same (or very similar) durations for all future Critical Power test inputs.

Interval Training
#6 is great for riders that regularly do hard aerobic interval work, especially indoors. The intervals need to be of sufficient duration, I would say at least two efforts of 20 minutes (with a short break between) at time trial power/pace. When done on an indoor trainer, then it is common for longer maximal effort intervals of 30 to 40 minutes be nearly equivalent to FTP. As training progresses over the weeks and months, then changes in sustainable power during these intervals is a great guide to changes in FTP.


I'd suggest the Seven Deadly Sins also include the following methods:

MAP Testing
5a) by conducting a Maximal Aerobic Power (MAP) test, using the test protocol on Ric Stern's website . FTP typically falls within the range of 72%-77% of MAP.
An example of a MAP test can be viewed here.

Shorter Time Trials
5b) by conducting a time trial effort of sufficient duration (say at least 20-min), with FTP typically falling into a range of percentages for TTs of this duration e.g.:
- FTP = 93% +/- 3% of 20-minute maximal average power
- FTP = 94% +/- 3% of 16km (10-mile) TT avg power
Of course everyone is different and some may fall outside of these ranges.

There really is no reason to nail it down to the nearest watt. Setting FTP to the nearest 5 watts is sufficient. I only change the FTP setting if there is hard evidence of a change of at least 5-10W.

Of course, getting the number right does depend on ensuring that a rider's power meter is correctly calibrated and any zero offsets needed are done. Strange numbers are usually strange for a good reason.

Remember, these are all just ways of estimating FTP and some are better than others at nailing down the number (and for many, some are more practical to perform than others). The final two methods for example, would typically get you to within a few percent either side and can then be cross referenced with another method.

It all depends on a rider's circumstances. Not everyone is in the position to do a ~1 hour time trial with sufficient regularity.

What do I use?
For the purposes of tracking aerobic fitness changes, and the setting of training levels, then performing a Maximal Aerobic Power test, combined with one of the other tests for FTP (usually a 16km or 40km time trial), is the method that I typically use with my coaching clients. Having this combination is particularly useful when assessing the training priorities for an athlete.

Of course, you can always track fitness and base training levels on a mean maximal power for a duration of less than 1 hour (e.g. a 20-minute test, or as has been suggested, 2 x 8-minute test efforts). However, by doing so you start to introduce the influence of anaerobic energy production into the test result, which means you may not be entirely sure which component of your fitness is changing, and hence be uncertain as to what type of training is needed in order to progress further.

So which sin will you choose?


This isn't the end of it of course. There are still a multitude of factors to consider, such as the impact of the following on FTP:
- Environmental effects
- Point of training cycle
- Chronic Training Loads
- Training Stress Balance
- Altitude
- Hills vs Flat terrain
- Different trainer types
- Different bikes and rider positions
- Motivation

I'll save that for another post.....

References:
1. Coggan, A. Ph.D, Allen, H. Training & Racing with a Power Meter, Velopress 2006.
2. Monnier, E.
Using the Critical Power Model to Predict Various Points Along the Power-duration Curve. http://velo-fit.com/articles.htm, 2004
3.
Stern, R. What is MAP?, http://www.cyclecoach.com/pageID-news-Test_yourself.htm, 1999

Read More......

Thursday, December 07, 2006

Testing 1, 2, 3...

About four weeks ago I wrote about one of the performance tests coach has me down for every so often - a 16 km (10 mile) time trial (or near enough to 16km). In my case I use the local training circuit - Sydney's Centennial Park and do a 4-lap TT. Well I just did another one of these on Tueday this week.

Ease Up!
In the lead up over last few weeks, my training was eased back a little, partly to give my body a chance to catch up with the CTL I had accumulated and in response to a few early signs of fatigue (like being unable to complete a set interval) but also a chance to have a race or two with a little freshness. Now I was by no means overtrained, not even close, and race power outputs have certainly been healthy enough. It also represents a segue into the next phase of training, where intensity of workouts really starts to pick up for the build towards the track championships next March.

So what's the Performance Manager telling us? Well this is an extension to the chart I last posted here on 23 October.

My lastest PMC

So since last time, we see CTL continue to build through to mid-November, reaching a peak of 98 TSS/day on 12 Nov (which is an all time peak CTL for me - last season my CTL peaked at 81 TSS/day). After that you can see the impact of my training easing back, with CTL dropping, going TSB positive and enjoying some good form at the track carnival up at Gosford.

And the test TT? Well here's the chart of the ride. Stats are shown on the left, with wattages by lap also indicated.

16km TT test

Pacing TTs well is a challenge for me. Let's face it - I don't do lots of TTs so my pacing is a less than fine tuned skill but I'm sure I'll get better with more practice. I'm a track/crit rider, used to the dynamics of that environment.

Last time I tested (1 Nov) I talked about how I picked it up a little mid-way, then paid the price in the final lap. Well this time I started slightly more conservatively (~5W less) than last time but found that the last lap and a half I was able to crank it up considerably. So in the end I averaged only 1 Watt higher than last test.


While it's not much of a PB (it's still a PB!), I am pretty happy with that as I had all the "mental sensations" of actually losing some aerobic fitness this last couple of weeks, so personally I wouldn't have been surprised to have struggled more than I did.
I suspect coach knows more than I do though....
Soft c**ks
Last weekend I was supposed to have a race but I turned up and found they'd decided to cancel since all these softies in Sydney go underground at the slightest hint of wet weather. So bugger it, I got on my bike and did some hard laps anyway. After eight circuits at Heffron I got a bit bored, eashed back for a short time then two other guys came through doing turns so I jumped in with them and we cranked it up for a few more good laps. So a neat little 50 minute effort. Then the rain came.

My MAP test is tomorrow and this weekend I race the Brindabella Challenge crit. Will report in next week.

Read More......

Wednesday, November 01, 2006

Testing Times

Well today was one of my regularly scheduled fitness tests – the 16km (10 mile) Time Trial effort. I’m not so much interested in the time it takes to complete the course as I am in the average power output for the duration of the effort.

If my fitness has improved (and I’m not too fatigued), then I should put out more power on average than I did last time I tested. It’s a much better gauge of progress than a stopwatch, especially on this day as conditions were quite different.

Regular testing is a really important part of any training programme - firstly it helps determine what your current capabilities are (as measured by average power output over a given duration or distance). That knowledge is then used to shape training plans suitable to improve the capabilities specific to your target event or cycling goal. Finally tests ensure that training is having the desired physiological impact. Adjustments to training can then be made according to results. Besides, tests are great workouts in themselves, so they should be part of any regular training cycle.


Well first let’s get the excuses out of the way…

This week we moved to summertime in Sydney, so the clocks have just gone forward an hour. My mid-week workouts are early morning, so getting up at 5am was really getting up at 4am… I’m not sure the body was quite adapted to surfing the pain curve quite so early in the morning. Then there was this strongish westerly blowing in (an unusual breeze that one) and that was going to make pacing a challenge on the circuit I use. Then in the warm up I’m thinking, why does it sting when I’m not really going that hard?
Oh just shut up and get on with it….

Anyway, with that lot out of the way, we get into the test. But how hard do I go? Well a couple of weeks ago I set a new 20 minute mean maximal power (MMP*) PB in a criterium race at Olympic Park. So I figure, that’s what I’ll aim for. Nothin’ but the best for me!

Ay yay yay! That hurt! In the course of a 4 x 4km laps I rode laps 1 & 2 at around the nominated power, then for some unknown reason I have visions that I can or need to go harder (surely I can go harder?), so I do and lap 3 is cranking (and hurting). Lap 4 was ugly.
Result

Well I beat my last test average power by about 10 Watts and set a new 20 minute MMP PB in the process! So there you go. Not so bad after all. Did I say lap 4 was ugly? Yep, it sure was ugly. I was definitely hurting more today that last time though… or maybe the pain memory of my last test has simply subsided.

Oh, and this is a 46 Watt improvement over my first test in August.
Test day stats:
CTL: 93
TSB: -8 (so reasonably neutral but on RPE it felt more like –15 or so)
And why is it that on power test days you swear the Power Meter reads low?

Here's a pic of the test results (click on pic to enlarge). Note how variable the speed was compared to power. This was partly the slightly up n down nature of the loop I was using but also the wind which was creating a pacing challenge. See the ugly last lap?

Dashed horizontal lines mark average power (yellow) and average speed (blue) for the course.

*MMP – the highest average power output for the nominated period within a ride (e.g. the best average 20 minute power within a 2 hour ride). Often shortened to 20min MMP, 60 min MMP, 5 sec MMP etc.

Why 20 minute power?

Well it’s a fairly common marker of aerobic fitness and is a duration that is readily repeatable either in normal training or regular testing, especially where 60 minute efforts are less frequently undertaken.

Read More......

Thursday, October 19, 2006

Team Time Trial and the Performance Manager


The performance manager is a killer tool for TTT efforts - and IMO would be the perfect type of event to illustrate the relationship between top end and TSB. A couple years back I did a few TTTs, some at positive TSB, some negative. The negative TSB TTTs were incredibly painful just to hit substandard Pnorm values...the positive TSB TTTs were as you say, exercises in restraint.
~ Dave Harris
A couple of weeks ago, three buddies and I contested our State Championships TTT (MMAS 2-4 category) on the constantly undulating Calga Course, about an hour’s drive north of Sydney. It was a late decision to enter, so no chance to get in a prior test run as a unit. There is a bit of a write up here and a couple of photos to boot.
Since three of the team are knowledgeable power meter users (including two members of the eweTSS PMC beta test group), I thought it would be interesting to see what the Performance Manager was telling us as a team.
If you want to know more about the Performance Manager, then this article on the Cycling Peaks site is a good place to start.

So who was where on the Performance Manager Chart curves?
Team CTL TSB
Peter 35 -12
Phil 82 +31
Stan 65 0 (as a rough estimate only)
Alex 84 –5
So before we started, we had a pretty fair idea of where we stood. Some sizeable CTL/TSB mismatches there.
Predictions anyone?

What the CTL/TSB mismatches really mean is that you'll probably have a better idea before hand as to whether you'll be the one doing the shouting or the listening!

Given the course in front of us was a hilly 43km out and back, FTP watts/kg was going to be as important as FTP alone (and we had a 22kg weight spread between us). Putting that together with the PMC data we knew/predicted/decided that:
  • Pete would be the sacrificial lamb

  • Phil would likely be ripping the cranks off and would have to be careful not to blow his mates
  • Stan we weren’t really sure about but he rode well in a test effort the week prior
  • Alex would be good but not as good as the weekend before when he entered the road & crit race championships with +ve TSB.
  • We thought had a chance of making the podium
So armed with that knowledge we already had a fair idea of how to attack the race.
So what happened?
  • Pete made it a little past half way (a fine ride if you ask me given his current weight disadvantage and low CTL).
    37 min; Pnorm 359W; IF 1.198
  • Phil was ripping the cranks off and basically had to hold himself back all day to ensure the team stayed as a unit.
    65 min; Pnorm 280W; IF 0.984
  • Stan did what Stan does best and rode a little hard early on, requiring some firm communication to bring him into line. He paid for it in the 4th qtr of the race (where his lower CTL perhaps was showing itself up). To be fair, Stan is the only one without a PM onboard to help him dose his effort.
  • I did what I could, felt like I struggled mid race but came good in the back half. Ended up with Pnorm bang on FTP but down on previous weekend’s peak.
    65 min; Pnorm 295W; IF 0.999
It was a fun outing and we came away with the bronze medal for our efforts (despite a slow change for Stan’s puncture – we did the maths, somewhere between 40-60 seconds lost or one step on the podium).


So in the end, the PMC was smack on in terms of predicting how we would go as a unit.
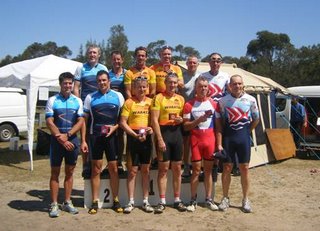
Lads on the podium.... (we're on the right)

Read More......