Showing posts with label Individual Pursuit. Show all posts

Wednesday, February 25, 2015

Pursuit Spaghetti: Elite Pacing

The 2015 UCI track cycling world championships in Saint-Quentin-En-Yvelines, France, have recently concluded and there's been some on-line chatter about the pacing of Silver medallist and former world champion and world record holder Jack Bobridge during the final of the 4000 metre individual pursuit. Seen through the lens of his recent unsuccessful attempt at setting a world hour record, some are wondering "what was Jack was doing going out so fast?".

While he does start too hard and probably needs to reel that tendency in, I don't think it's quite the same as for his hour attempt. While many of the challenges are similar, pursuits are a different beast.

Some seemed to think he set out to catch his opponent in the final, and if you look at how he rapidly gained on his opponent in the early stages you'd think that might just be the case. Except I can't believe that would have been the strategy for various reasons (mainly since it would have required elite level kilo TT pacing to achieve it and so just wouldn't have happened). It also doesn't bear out in the data.

To explain this I thought I'd look at pursuit pacing at the elite level in general, as well as show what actually happened during the final between Bobridge and Gold medallist and winner Stefan Kueng of Switzerland.

Congratulations to Kueng by the way. He was Bronze medallist in 2013, Silver medallist in 2014 and is now the 2015 World Champion. That's a nice progression.

So here are some charts for you viewing pleasure.

The first shows the half lap (125 metre) times for each rider during their qualifying ride. it's a bit of a spaghetti junction, so I'll also show just the finalist's qualifying rides as well. Click the image to view a larger version.

2015 UCI World Championship 4000m individual pursuit qualifying
So what are we to make of this lot?

Well firstly I have highlighted the two lines for eventual winner Kueng (yellow) and Bobridge (red). This was their qualifying ride compared with everyone else (except for the Hong Kong rider whose times were a bit slow for this plot).

Also shown is a straight white line marking a slope representing a fade in pace of one second per kilometre. I use this as a guideline to assess whether a rider's pacing was good or poor. If you faded more quickly, then you started too hard, and the method of energy distribution wasn't optimal for attaining the least time possible.

It's pretty evident that many of those pacing lines are fading much more quickly than one second per kilometre. These are not novice riders but the best from their respective nations and some of the best in the world. This is a world championships and yet this most basic pacing mistake is still made.

That doesn't mean that pacing with more of a "flat line" is ideal either, although it's somewhat less of a sin than starting too hard and fading rapidly.

Pursuit pacing is a complex pacing optimisation problem. Dr Andy Coggan discusses this a little in the 3rd part of his excellent three part series: The Demands of the Individual Pursuit, so head there if you'd like to learn some more.

If you were able to speed up through the event, well it's also likely you've left some speed out there. Nailing this event takes practice and some years.

Let's clear away some of the noodles and look at the finalist's qualifying rides:

It's pretty clear that Bobridge starts hard and fades rapidly. Too hard and as a result, too rapidly. Kueng's pacing shows a negative split/getting faster in the second half, which suggests he left some pace out there.

Kueng had a qualifying advantage over Bobridge (and most of the field) in that Kueng rode in the final heat, while Bobridge rode the second heat. Kueng had earned his final heat advantage due to his Silver medal the previous year. This meant he knew his task to make the gold medal ride off was not to match Bobridge's time, which at that point was still the fastest qualifying time, but rather to beat his heat opponent and to beat the second best time up to that point, which was several seconds slower than Bobridge had ridden.

That meant Kueng's schedule could be more conservative than Bobridge's. This saves precious energy for the final, while Bobridge had to put all he had out there. As it turns out, Kueng's qualifying opponent (Alex Edmondson) faded in the final kilometre, which saw Kueng gaining but not quite catching him. That's pretty much the perfect scenario for a rider as you gain an increasing draft advantage in the final laps just when you need it, but don't waste precious energy passing your opponent. Bobridge caught and passed his opponent with 3 laps remaining, and it shows in his qualifying ride data.

The other two finalists show pretty reasonable pacing, however in the final laps their times blow out and rise rapidly. This is most likely because, like Bobridge, they caught their qualifying ride opponent and had to make a pass. As they approached the other rider they receive the benefit of some draft and that benefit increases the closer they approach, but then they have to make a pass and the acceleration to do that costs energy as well as track position. That's why you see that dip in track time followed by the rise. Once past their opponent, they are back out in the front with no more draft benefit and on fatiguing legs after having upped the power to make a pass - hence their lap times increase rapidly.

Here are the pacing plots for Kueng and Bobridge comparing their ride in qualifying (dashed lines) and in the gold medal final (solid lines):
Kueng and Bobridge pursuits: Qualifier and Final

We can see that Bobridge started his final almost exactly as he had done in the qualifying ride. Too fast again. This time his fade in pacing was even sharper. Kueng started a little harder than in his qualifier but still more conservatively than Bobridge. Kueng also started to fade at the halfway mark, just not as rapidly as Bobridge was dropping pace. It made for a fascinating race. Kueng only took the lead from Bobridge in the final half lap. Exciting stuff.

So thinking back to that first chart  - is this a common theme - that of elite riders starting too hard and riding a slower time than they might have done?

Well here are some more plots for the 2014 and 2013 world championships.

First the 2014 championships which were held in Cali, Colombia. This 250m wooden track, while covered, is exposed to the wind and so we can see the more variable pacing in the half laps times as riders battled slight head and tailwinds as they circulated the track. This undoubtedly makes pacing an even trickier challenge.

The two gold medal finalists are highlighted with the thicker yellow and red lines, yellow for the eventual winner. I'm guessing by looking at these lines that Kueng rides a bit more by feel than by pace and permitted his speed to vary more with the breeze. By and large most riders were fading by around 1 second per km or slightly more, so still some room for improvement.
2014 UCI World Championship 4000m individual pursuit qualifying

Here are the qualifying rides by the four finalists:

In 2013, the World Championships were held in Minsk, Belarus. Again the gold medal finalists are shown with yellow and red lines, but some of the pacing is just bizarre for world level.
2013 UCI World Championship 4000m individual pursuit qualifying

As with before, here are the qualifying rides for the four finalists:

So there you have it, three years of world championship pursuit spaghetti. Delicious.

Read More......

Wednesday, July 13, 2011

Individual Pursuit - What Makes us Faster?

A long time ago, in a galaxy far away, a Jedi Knight called Andy Coggan developed an insightful (but often misunderstood) table of numbers known as Power Profiling. Power junkie cyclists have been (mis)using the table to psych out their mates for years now.

The Power Profiling table lists power to body mass ratios for four key durations: 1-hour, 5-minutes, 1-minute and 5-seconds, chosen to reasonably represent the energy systems/physiology that predominantly underpin performance over these duration, i.e. (respectively): lactate threshold, maximal oxygen uptake (VO2max), anaerobic work capacity & neuromuscular power.

Power to body mass ratio is an excellent overall predictor of performance potential. It is especially good for determining performance when climbing hills.

However, performance in flatter time trials and individual pursuits is much more a function of power and aerodynamics than it is of power and body mass. Body mass of course impacts aerodynamics, however the relationship between them is variable, with overall morphology and position on a bike far more influential than body mass per se.

So, when choosing the one performance factor most important for flatter time trials and pursuits, one needs to focus on improving a different ratio – the Power to Aerodynamic Drag* ratio (power to CdA ratio - W/m^2).

The higher the W/m^2, the faster we go. Pretty simple really.

In 2009 Jedi Knight Coggan, being somewhat prescient, developed a draft version of his power profiling table, this time expressing performance in terms of the ratio of 1-hour power to CdA . I’d love to share a link to it, but I’m not sure I have a public location I can point you to (it was originally posted on a discussion forum about two years ago which has suckerific search function). I’m sure either Andy will provide a link, or post up a new blog item about it at some stage.

In any case, I thought at the time it might also be of interest to develop a similar table for the Individual Pursuit, so Andy whipped up one for me, and I then took that data and created a chart and table. Now that was nearly two years ago and I've been meaning to do a blog post about it ever since! Okay, so it's a little late but here it is.

The table show times for 2km, 3km and 4km individual pursuits and the corresponding W/m^2 required to attain that performance (click / right click to show full sized version):


So, for example, if you want to ride a 3km pursuit in 3:35, you will need a power to aero drag ratio of about 1900 W/m^2.

Alternatively, if you know your power and pursuit time (on a fast track), then you can back calculate an estimate of your CdA. e.g. a rider who completes a 4km pursuit in 4:30 requires a power to aero drag ratio of ~ 2200W/m^2.

If we know their power output we can then estimate their CdA. Let’s say they averaged 480W.
CdA = (480W) / (2200W/m^2) = ~ 0.218 m^2

It’s not perfect of course, just a guide and there are many factors to consider. Besides, if you have a power meter on your track bike, there are better ways to determine your CdA.

The chart below plots the same data, as well as show where on the chart the current world record holders appear for the following categories:

Elite Men & Women
Junior Men & Women
Masters Women

Hence, these world records represent the current upper limit of W/m^2 for each category:


The records are from the UCI website here: Track World Records

With the exception of Sarah Hammer’s WR in Aguascalientes, all of the others were set at sea level and in indoor velodromes (and so the assumptions used for the table data will be closer to the mark).

In the case of Sarah Hammer, due to the significantly reduced air density at altitude, it is probable her W/m^2 is overstated and is a little less than previous world record holder Sarah Ulmer whose record was set at sea level. The Power/CdA estimate for Ulmer’s 3:24.537 ride is 2200 W/m^2.

One thing the chart emphasises is just how much one needs to improve W/m^2 in order just to go even just a few seconds faster. When you are near your physiological performance (power) limit, we can see how important aerodynamics are to overall performance.

And just how freakin good those world record rides are.


Now of course there are some assumptions used to make up the data for the tables (assumption are shown on the table and chart). For example, it does assume a pretty fast track/tyres at a typical sea level air density, but really it’s just a guide, and serves to emphasise the importance of aerodynamics and thinking in terms of W/m^2 when working out what to focus on to improve your pursuit and time trial performance.

If your track and/or tyres are slower than the best, then it’s likely the performance suggested as attainable from a given power to aero drag ratio is overstated (or the W/m^2 required for a given performance is understated). Also, the rate of change in kinetic energy and associated variable power demands will also have some impact on these estimates. These data have used typical assumptions for that, but of course everyone’s initial acceleration, mass and fade in speed during their pursuit rides are different.

I’ll look into doing a similar chart for the hour record at some stage.

Where do you fall on the table?


For those interested in more discussion on factors impacting pursuit performance, then these items by Andy Coggan are a great place to start:

Demands of the individual pursuit, part 1
Demands of the individual pursuit, part 2


* Aerodynamic Drag is expressed as the combination of our two factors:

- Coefficient of Drag (Cd), a unit-less measure which is related to the shape of an object and how that affects air flow around it (e.g. think of a brick vs a bullet shape, the bullet shape has a lower Cd); and

- Effective Frontal Area (A), measured in square metres (m^2) which is how much area we present to the air (e.g . compare a van and a Mack truck – the truck has a larger frontal area and has to push more air).

These two factors are multiplied together to determine how "slippery" we are through the air.

Some example typical CdA values:
Commuter cyclist: 0.4 – 0.7 m^2
Road racing cyclist: 0.26 - 0.38 m^2
Time trial/pursuit rider: 0.2 – 0.3 m^2
Sports car: 0.5 - 0.6 m^2

Read More......

Wednesday, March 16, 2011

Anaerobic Stuff - Mr Peabody's WABAC Machine

Time to get into Mr Peabody's WABAC Machine. C'mon Sherman, let's wind the clock back to 2007....


This post is another take on my February 2007 Darth Vader item. Back then I wrote, with considerable assistance from Mr Peabody - er, I mean Dr Andy Coggan, an item about Maximal Accumulated Oxygen Deficit (MAOD).

Andy introduced the concept of using power meter data from a well paced individual pursuit as a means to estimate MAOD (which ordinarily would require lab based testing). He expands on it in the book, Training & Racing with a Power Meter, pp 244-248 (2nd edition).

Just to recap, MAOD is the "gold standard" measure of an athlete's anaerobic capacity. Expressed in litres of O2, it's the difference between the energy produced aerobically and the total energy demand. In an event such as the individual pursuit, a rider's total energy output is typically ~ 70-80% via aerobic means and the balance of course via anaerobic metabolism.

So I thought I'd take the analysis method from that previous post, run it on my recent events and add another twist - the points race.

In recent posts I've mentioned a few track endurance* events I've raced:
- 4km Individual Pursuit (Aussie National Championships - C4 paracycling)
- 2km Team Pursuit (Masters 150+ State champs)
- 20km Points race (Masters 45-49 State champs)

Edit: I've since updated the list to add in the 1-kilometre time trial I raced at the Paracycling nationals the day before the 4km individual pursuit.

It's all part of my comeback to competitive cycling, as these are the events I most enjoy. Well except for the individual pursuit. That's an event impossible to enjoy. But it's fun to do some analysis of pusuiting because it reveals so many things about a rider. Physiologically, technically, aerodynamically and psychologically.

In the weeks and months before my accident in 2007, I rode the same events, the only difference being the individual pursuit was 3km, not 4km and the team pursuit was 3km then vs. 2km this year (different distances for different masters age and paracycling categories).

I've been riding these events for many years but 2007 was my best season up to that point, with a win in the Team Pursuit (in a new state record time), a bronze medal in the National Masters Points race champs and two personal best times in the 3km IP. So for me, relatively speaking, they provide very sound benchmarks for how I've bounced back since then. I'm not going to go into that here though as I've already covered that a number of times.

OK, back to Mr Peabody and the analysis. Here's the chart showing cumulative O2 deficit from my recent races:


Click on the pic to enoxygenate (apologies for the Phil Plaitism).

The picture details the cumulative O2 deficit for four rides - my individual pursuit (red line), the team pursuit (blue line), the 1-km TT, and also a roughly 5-min section from my points race last weekend (the Richie Benaud cream jacket tan line). I'll get to the points race later.

Just to explain the chart - let's take the red line for the individual pursuit. You start the event from a dead stop (your bike is held in a starting gate which releases on count down to zero) and then accelerate over about 15 to 20 seconds to a high cruising pace, which you are then attempting to maintain for the balance of the event. The red line is a measure of how much oxygen "debt" I am incurring as time passes.

I incur this O2 "debt" since my power output in a pursuit is somewhat higher than my sustainable threshold power (which can be produced almost wholly via aerobic metabolism - or in a "pay as you go" sense). Once you ride above threshold, you are tapping into your limited anaerobic work capacity - and it really is limited - meaning that such efforts are by necessity going to be short lived. Harder you go, the less time you'll last. Nothing new about that.

Not only that but once you expend your limited reserve, in order to continue you will have no choice but be forced to ride under threshold in order to recover the O2 deficit. This is why pacing your effort is so crucial in timed events, and in mass start racing why dosing out the hard efforts at the right time is so important. The cost of "blowing up" is considerable in performance terms.

It's also why improving threshold power is so crucial. When you do go into the red zone in a race, you don't incur as much O2 deficit, or can last for longer at that level. And when the pace eases up again and you dip below threshold more quickly, you recover faster meaning you are ready for the next attack before someone else is. Counterattack anyone?

How do we determine this aerobic/anaerobic contribution with a power meter? Well as per the book, it's matter of looking at O2 kinetics of a well paced pursuit:


Andy showed that we can plot, along with the actual power output from a pursuit, a line representing a rider's theoretical maximal aerobic power output based on lab tests of a rider's VO2max** and efficiency***.

Except that in my case, I don't have the latter. Never mind, since the steady state part of a well paced pursuit represents power output at VO2max, we can simply adjust those VO2max and efficiency values so that they match the steady state portion of the pursuit power file. I assumed an efficiency of 22.5% and adjusted my VO2max value until it fairly represented my steady state power output in the pursuit. It came out at 58 mL/min/kg. If you change the VO2max (or efficiency) value, it moves that maximal aerobic (red) line up and down accordingly.

OK, so that's pretty funky, I can estimate my VO2max (or at least a range given that we assume efficiency is in a range typical for trained cyclists).

But by then directly comparing the difference between the maximal aerobic power, and what power I actually produced, we can then attain an estimate of the proportion of energy output from anaerobic contribution.

In my case, it estimates about 17% of my energy was from anaerobic supply. That's a little lower than typical for a pursuit, but my race time was 5:08, which is longer than the 3.5-min to 4.5-min efforts for elite riders in 3km and 4km pursuits and so it's not entirely surprising.

It also means that my MAOD was estimated at 4.16 L. We'll tag that number for now.

OK, so how about those cumulative O2 deficit lines?

In the WABAC machine we saw the way the O2 deficit would climb at different rates when riding a team pursuit as a rider alternately takes a pull on the front (O2 deficit line increases at a faster rate) and then gets back in line and recovers (where the line either rises more slowly or can even fall if the rider is quite powerful and not overly challenged by the team's pace).

If a rider exceeds their MAOD, then there is a pretty fair chance they will crack, which in a team pursuit means they are unable to continue and pull out after their turn on the front, or as sometimes can happen they cannot even maintain the pace of the rider(s) in front and they end up creating a gap in the line, which is bad news.

So I plotted the cumulative O2 deficit line from my recent individual and team pursuits and they shows the same pattern as in 2007. The team pursuit line is much shorter of course since the event is half the distance of the individual pursuit, and in a team, so it is considerably faster.

I also plotted the same line from a section of my points race on the weekend. I chose a starting point very early in the race, it was about lap 6, with 4 to go to the first sprint. My team mate was on the front at the bottom of the track, he slowed the speed down a little in the preceding half lap and then launched an attack, I was on his wheel and went with it.

I had to go pretty hard, with peak power reaching 1184W in order to cover it (he's a world class masters sprinter but not on form right now). The idea was to see what we could get from it - either get a break happening or at least pick up some early points for later strategic benefit.

Problem was, he cracked pretty quickly and I was left with about 3 laps to the sprint line. I was committed, had a gap, so went for it. The cumulative O2 deficit line shows just how deep I went. Very deep.

Once the sprint line was passed I then had to do everything I could to ensure I stayed in the race. You can see how the cumulative O2 deficit line drops away as I reduced my power output and went on the hunt for good wheels to follow. Not long later you can see the line begin to rise again as the next sprint was approaching. I sat that one out just making sure I got through unscathed and could cover any counterattacks.

When you look at the blue line tracing my cumulative O2 deficit from the team pursuit, it reaches a maximum of 4.26 L (about 2.5% higher than from my individual pursuit) and in the points race I reached 4.46L (7% higher than in the IP). What's going on there?

Well, a few things:

- firstly, there is normal day to day variability in performance.

Given that in this analysis we are keeping VO2max and VO2 kinetics**** constant, then the performance is wholly expressed as a difference in MAOD. And since anaerobic contribution to power output is still only 25% or less of total over several minutes, then it still only means a difference in performance of ~ 20-25% of 7% or less than 2% of the total power/energy.

- the next obvious difference is group versus solo efforts, and the influence of motivation/psychology

I would never discount the role that motivation can have on performance and perhaps I am capable of pulling just that little bit more out of myself in a team or a mass start event than I can in an individual pursuit. I can't imagine how I could go any harder in the IP, but it is interesting nonetheless to see if there's any more blood to get from this stone.

- thirdly, as Andy mentioned to me, lab studies indicate that MAOD is independent of the duration of the effort, although he doesn't recall any studies looking at efforts quite as long as this (~5-min). Perhaps that is a factor as well.

So there you have it.

As for the points race, well that attack was a very big risk and a large match to burn so early on. I really needed it to either form a successful break or net 5 points in the opening sprint (3 at least given the race favourite was always going to be very hard to beat). I was overhauled on the line and ended up with 1 or 2 points (I forget exactly) and so it meant I had not gained the desired return on investment. It sure wasn't through lack of trying.

It also meant that since I had gone so deep into O2 debt, I would need every ounce of craftiness to stay in the race. Perhaps in going so hard, the chase was not so easy either and everyone else had to recover too and that was just enough to keep me alive. Thereafter I just took my opportunities to collect points as I felt able. I had to gain 3 points in the final sprint to have a chance but didn't have the legs for that last lap to contest. It was enough for a 4th place finish. Had my initial salvo netted 5 points, perhaps the result may have been different and I made the podium instead.

That's bike racin'.

Edit: Since posting this the other day I also added to the chart the data from the 1-kilometre time trial. As we can see, I reached a MAOD of 4.30L, which is consistent with giving it all and with the MAOD values attained from the other efforts. Not sure if it affected the value attained in the pursuit on the next day, but does highlight the day to day variances.

Thanks again to Andy Coggan for his inspiration, Ric Stern for getting my form to such a good stage and all those team mates and competitors and supporters who help bring the best out of me.


* We call them endurance events, since even though they are about as hard as hard can be and relatively short in duration as far as cycling events go, they are still fundamentally aerobically (with oxygen) "fueled" efforts, albeit with some sizeable contribution from our anaerobic (without oxygen) energy systems.
** VO2max is the maximal rate of oxygen uptake by the body, typically occurs when exercising very hard for several minutes, although it can be induced with efforts lasting over longer periods (VO2 slow component). Expressed as litres of O2 per minute, or in relative terms as litres of O2 per minute per kilogram of body mass.

*** the proportion of mechanical energy output delivered to the bicycle crank as a ratio of total energy metabolised by the body - trained cyclists are typically around 19-24% efficient. The balance is almost all given off as heat (which is why we get so darn hot when going hard).

**** Initial VO2 assumed at 0.5 L/min and half life for VO2 assumed to be 25-seconds.

Read More......

Sunday, February 06, 2011

Form = Fitness + Freshness: Take 2

A few weeks ago I posted about gaining some form after a race win in a local crit.

Here's take 2.

Yesterday (Saturday) and Friday I raced the Aussie national track cycling championships in the para cycling categories at the Dunc Gray Velodrome here in a blazing hot Sydney. There are only two events for individual para cyclists - the time trial and the individual pursuit. So I enter both. For my para category (C4) that means a 1-km time trial and a 4km individual pursuit. Ouch.

The day before that I had to go through reclassification. I was first classified in 2009. I suppose there was a slim chance my leg might have grown back since then.

Not having raced the "kilo" before, I just went at it hard but keeping a fraction in reserve on the opening lap. The kilo is raced as an individual, whereas in the pursuit you are racing on track at same time as your opponent (starting on opposite sides of track).

I finished the kilo in a 1:16. My opponent rode a 1:15. I was 1 second in front after 750m but my fade in the final lap saw my opponent overhaul my time. Happy with that. Much room for improvement from me, so something to think about for next year. A little more than a couple of week's notice of getting a ride might help...

The next day we had the individual pursuit. Here's my power trace:


Just power and cadence showing.

Stats:
Average Power: 363W
Time: 5:08
Place: 2nd

Again I was pretty happy with that. My 5-min power/weight ratio was an all time personal best pre- and post-amputation, and the time was 4-seconds faster than previous national record. My opponent though had a fantastic race, going 4:58 and setting a huge new PB for him. Nice work Ryan! :)

CTL: 96
TSB: +8

Once again, Form = Fitness + Freshness

Next up - Team Pursuit later this month.

Read More......

Monday, January 17, 2011

Form = Fitness + Freshness

It's one of the Pithy Power Proverbs that came along with the introduction of the Performance Manager Andy Coggan introduced to so many of us in 2006.

Five years on and it still works.

Example:
In the last couple of weeks I've been bouncing around with a Chronic Training Load (CTL - "fitness") above 100 TSS/day (see link for an explanation of these terms) but had some external life stresses and work commitments (like refurbishing and expanding a growing indoor cycle training centre amongst other things) which combined saw me "crack" a little in training. Not badly, just enough to know it was time for a little recovery.

By cracking a little I mean being unable to successfully complete a scheduled hard tempo session within a desired power range a couple of times and one endurance ride that was a bit of a grovel. One bad day isn't always a sign, but 2-3 examples not far apart is something usually worth taking a closer note of.

So I shut down the session the second time it happened and had a rest day the next day. It is also very hot and humid when I get to train which likely did not help, and combined with insufficient sleep, well the signs were all there.

So an extra day's rest, combined with a few no-bike days due to coaching work commitments saw a sharpish drop in Acute (recent) Training Load (ATL) and a corresponding rise in Training Stress Balance (TSB - "freshness").

On Saturday I had my regular squad training group (which I run) and said to myself that if I feel OK, I would go race in the afternoon.

As it turns out, I did feel pretty good in the morning, so I decided to line up for a crit that afternoon (at Sydney's Heffron Park).

I win.

Which is always nice of course. A good way to start the year off.

Winning move was made when I attacked with a bit under 3km to go.

A few things to note for day of race:
- FTP: 295W - my last TT in December was @ 297W (38-minutes)
- CTL: 96 TSS/day
- TSB: +19
- NP*: 300W (50-minutes)
- AP^: 257W

Race was not overly hard, I was pretty well in control most of the time. I had a solo break mid-way but that failed due to a rear puncture (was given a replacement wheel and allowed to rejoin main group).

The final 4-minutes of the race was a new
all-time best 4-minute W/kg.

Now ordinarily I wouldn't expect to feel so good with TSB that high. Neutral to somewhat positive TSB yes, but at +19, sometimes you feel underdone or legs are a bit claggy. Not today.

Fresh and Fit. Toss smart into the mix and well, wins are there to be had.


By the way, I know it's been way too long since I've posted. It's just been a very busy 12-months. All good stuff and I hope to be able to get back to more regular posting. I have a backlog of items to write about!

A super full year of events coming up in 2011. So much happening on the coaching, training and racing front, I will endeavour to keep y'all updated!


* Normalised Power
^ Average Power

Read More......

Monday, March 26, 2007

National Lampoon Pursuit

Ouch!

Wow - that hurt. Today was my Individual Pursuit qualifier. I rode a PB, which is good but I was hoping for a better time.

Time was 3:47.770 - about 1/4 second faster than Sydney a fews weeks ago. I set out to ride a 3:45 schedule and was on bang on target at the 1km and 2km marks but the last km got me I'm afraid.

But here's the rub....

Average power: 420W - that's 35+W more than Sydney. I'll have to check the atmospheric conditions but that's a whole lot more power for not much extra speed. Yikes, no wonder I was crawling on the floor looking for somewhere to be sick after that.

Leading riders in my Div were doing low 3:30s. Wow.

World and Australian Masters champs were getting knocked off their perches everywhere today.

Anyway, for the record - here the pursuit file with three second smoothing applied. Click to see a larger version.


When I get more details, I'll post some stuff about my buddies who all did well. Tanya rode her target time (4 seconds better than Sydney) and Michelle won gold with a solid 3:36 in the final as well as catching her opponent.
Tomorrow is sprint day, so I get a day off from competition although I have a ride planned.
Cheers!

Read More......

Thursday, February 01, 2007

Darth Vader Rides the Teams Pursuit

MAODMaximal Accumulated Oxygen Deficit is the theme of today’s chat.

This is something I first learned about via The Book (Training and Racing with a Power Meter) and also in subsequent analysis of power meter data kindly undertaken for me by Dr Andy Coggan last year. It’s pretty funky stuff, so hang on for the ride if you can.
Original Wattage list reference here and the Excel file used to generate such analysis is here.
For those interested in delving further, Andy has also prepared a Powerpoint presentation on the topic of the demands and preparation for individual pursuiting which is available for download at the Fixed Gear Fever download page. It's worth a look.
First, let me go back a step or two…

Technique plays a big part in Team Pursuiting
As some would know by now, I’m targeting two predominantly aerobic events, which have an anaerobic twist – the individual pursuit and points racing. Along the way, I get the chance to ride in one of my favourite events, the Teams Pursuit. A description of all these events can be found here. A quick glance at my recent posts and you’ll see that my team had success this past weekend, winning the NSW State Master’s Championship.
Two members of the team (Phil & myself) used power meters during the qualifying and final rides. We also both have power meter data from previous individual pursuit efforts. So, what can we learn from such data, in particular what can it reveal that may assist us?
As is already explained in a discussion about the Individual Pursuit in the book (pp 189-192), the performance of a rider in an Individual Pursuit is primarily determined by the combination of their aerobic and anaerobic work capacities. The discourse demonstrates that power meter data from an individual pursuit can be used to estimate the proportion of a rider’s power that is being generated from each of their aerobic and their anaerobic energy systems.
In particular, it is possible to use this data to estimate a rider’s Maximal Accumulated Oxygen Deficit (MAOD) – the best measure of a rider’s anaerobic capacity.
Based on this information, conclusions can be drawn about a rider’s individual capacities and it can help decide the type of training specific to that individual which is most likely to optimise performance (i.e. what specific training leading into the event will make me go the fastest I can go?).
Of course, in an individual pursuit, a rider typically accelerates up to speed and then settles into a quasi-steady state power output, typically at a level equivalent to their power at VO2 Max. See example here. The time taken to reach that VO2 Max power level does vary by rider and is proportionally longer for athletes with higher anaerobic work capacities.
In a Team Pursuit however, the demands are subtly different. While the overall aerobic and anaerobic demands are similar to an individual pursuit, the Team Pursuit also requires a greater degree of technical skill (for riding at 55+kph in an aero pursuit position just inches from the wheel in front, riding a good line in the bends and to effect smooth change overs of the lead rider).
It also places a greater emphasis on neuromuscular power (as the power demands are significantly variable compared to an individual pursuit – e.g. going from following a wheel to being on the front without changing pace demands a significant & rapid change in power).
So in a sense, not all aerobic monsters will necessarily make good team pursuiters. Riders like Brad McGee, Stuart O’Grady and Graeme Brown however all possess sensational aerobic engines and have the skill and top end power required for success in such an event.
Meanwhile, back in the Death Star....
So can we apply the MAOD analysis to Team Pursuit power meter data given that you never reach a quasi-steady state in such an event? Well originally I didn’t think it would be valid but as is his way, Dr Coggan showed it was possible (there are a couple of caveats which I won’t go into here) and he came up with some pretty interesting results.
Let’s start with Phil’s data. Rather than rewrite what Andy has already written, let me simply quote him here:
“In a laboratory setting, the gold standard for measuring anaerobic capacity is maximal accumulated O2 deficit (MAOD), i.e., the summed difference between the energy you produce aerobically and the overall energy demand. While we obviously don't know Phil's VO2 during his efforts, his VO2 kinetics, his VO2max, or his efficiency, it is possible to make some reasonable estimates and thus to estimate MAOD, as I did for Phil last year.
Evolution of O2 Deficit
(click/right click on chart to see an enlarged version)

As you can see in the graph titled "evolution of O2 deficit", during the individual pursuit his O2 deficit (the dark blue line) increased progressively for the first ~2 min of the event, after which it apparently became strictly "pay as you go", i.e., all of the power was apparently being generated aerobically.

This is exactly what you expect and what you typically find, with the only real difference between individuals of differing ability being the absolute values and the time point at which all of anaerobic capacity is expended (e.g., for me, it only takes ~1.5 min, whereas for my wife it takes 2.5 - 3 min).

So, what happens when you extend the same logic to analyze the team pursuits? Interesting stuff, that's what! :-)

Specifically, during the qualifier Phil's O2 deficit (the purple line) grew rapidly during the first 40 seconds, then held steady while he was on the wheels, then grew again when he took a pull, recovered a bit, and so on. Notably, however, at no point did it achieve the same value as during his individual pursuit last year. Assuming that he's in roughly the same shape now, this implies that he was never completely at his absolute limit, and thus was able to call upon his anaerobic reserves when he had to elevate his power above his aerobic maximum while taking his turn at the front and then getting back on again.

In contrast, during the final the power requirement was significantly higher from 40 seconds on, such that his cumulative O2 deficit (the yellow line), while flucuating a bit due to being in a paceline, essentially followed the same time course of that seen during the individual pursuit. IOW, in this case he *did* appear to be at or near his absolute limit throughout almost the entire race, so he simply couldn't recover after taking that final pull."
~ Andy Coggan
Now I should add that the final was ridden at a pace ½ second per lap faster than the qualifier and that Phil played the role of lead rider (I knew Phil had the experience to pace the start to schedule). In the final after his third pull, Phil had reached his limit and withdrew from the pace line, leaving the three remaining riders to complete the final three laps (in team pursuits, it is the elapsed time of the third rider across the line that determines the result – assuming you don’t catch the other team).
½ second quicker per lap may not sound like much but as you can see from the chart, it can quickly take someone from being “comfortable” to being right on or over a their limit.

Use the Force, Luke
OK, Andy has shown us something pretty funky with Phil’s data, so what did mine look like? Click/right click on pic to see an enlarged version:
Well at first glance it looks similar to Phil’s chart, however there are some significant differences:
- My cumulative O2 deficit in an individual pursuit (the dark blue line) is of a lower overall magnitude than Phil’s
- In the Team Pursuit qualifier (the purple line), it is apparent that I never fully depleted my anaerobic reserves, whereas Phil did slightly during the initial laps (Phil was the lead rider, so that is not unexpected). Indeed looking at the O2 deficit line, it is apparent that I was recovering quite rapidly when back in the pace line.
- In the Final (the yellow line), once again I did not exceed my anaerobic capacity until it was time to do a pull on the front. But note my recovery when back in the paceline compared to Phil’s. While Phil’s cumulative O2 deficit effectively kept climbing (indicating a depltion of anaerobic reserves), I was recovering sufficiently to enable another two strong pulls on the front, especially the final effort on the last lap and a bit (which took us from behind to in front of the other team).
- So it appears that I too am in at least as good a shape as last year but one should never discount the positive impact that motivation has on one’s ability to find a little more from somewhere within. I have always been a highly motivated rider in a group scenario.
In summary, once again this demonstrates the value of power meter data. Would have I done anything differently armed with such information? Perhaps. With data from all riders I may have decided on a different rider order. Certainly we rode as hard as we could but could have we used our resources more effectively and achieved an even faster time? Next year I expect all squad members will have power meters and perhaps I’ll be able to back up my intuitive assessment with a more objective look at the data.

One thing is for sure, be careful when you ask a sprinter to provide sideline-pacing instructions to a team pursuit squad!
Photo courtesy of Action Snaps photography

Read More......

Tuesday, November 21, 2006

Trials and tribulations

Well, more trial than tribulation.....

Here I am in pursuit mode
(this one's from the team pursuit titles earlier this year)
Last night I was scheduled to ride a trial individual pursuit - to set an early benchmark as I progress towards State & National Masters track champs in March. For me this means a 3,000 metre effort from a standing start on a velodrome. Fortunately I have good access to a world class indoor facility - the Dunc Gray Velodrome. And given that, along with John "JB" Beatty, I supervise the Monday night track training at DGV, I pulled coach's privilege and had a ride myself.
The individual pursuit is a funny event - it plays with your mind. But that's a whole other story.
So after a warm up I get the track to myself and decide on a schedule to ride a 3min 50 sec time.

Here's the result:

The power and speed graph from my trial pursuit last night.

And the numbers:
Pursuit Trial:
Duration: 3:14
Distance: 2.496 km_________Min_____Max_____Avg
Power:___346_____892_____433 watts
Speed:___8.3____48.5____46.2 kph
Temp:_____________________24 C
Air P:__________________1016 hPa
Cruise speed:_____________47 kph
Gear:___________49x14 (94.5")
Cadence at cruise________107 rpm
CTL:____________________93.4
TSB:___________________ +1.5


The more astute reader will notice I pulled the pin with 2 laps to go. Maybe that was the wrong thing to do but it was the decision I made on the spot - I just wasn't ready to dig a big hole for myself. I was going slower by that stage and speed wasn't great to start with.

An all time 3 min power PB though. By quite some margin so the training on the engine is working fine.
Hmmm. Don't really understand the slow speed for such power?

I started out pretty conservatively for me, peak power under 900 Watts and I didn't overshoot the target speed by much (if at all). So all I can conclude is that I need to work more on the aero position. I have a new frame in mind which will provide a far greater opportunity to improve my aerodynamics. On my current rig I am using a Look Ergo stem and it is just about already at full downward tilt. I'll just keep playing with it.

'til next time....

Next weekend is the Central Coast track open. Should be a hoot.

Read More......

Monday, November 06, 2006

In Pursuit of Perfect Pacing

(or how to go faster without really trying)

Reproduced from an article I wrote in May 2006 for Velosportz.com.au


The Individual Pursuit is one of cycling’s gold riband events that almost every cyclist should try at least once in their careers. It is one of the most challenging cycling events there is and taxes a cyclist’s abilities to the maximum. It is also a really solid indicator of a rider’s physical abilities across many cycling disciplines. So how on earth do you ride one well?
Well there are a lot of things about being and/or becoming a good pursuit rider and I’m not going to attempt to cover them all here (I certainly don’t profess to be an expert). What I will share is some first hand information about pacing and its importance, since it is the most important skill in pursuiting.

Individual Pursuit (Men/women) – Courtesy of Cyclingnews.com

Held over 4000 metres for elite men and 3000 metres for elite women (shorter for masters riders), this is considered an "endurance" track event, although the speeds are still extremely high. Two riders start on opposite sides of the track and try to set the fastest time over the allotted distance. Normally, a qualifying time trial is ridden that determines who is eligible for the finals. The fastest ride is often produced here, as in the finals, the only important criterion is to beat your opponent. If one rider catches the other, i.e. puts half a lap into them, then the race is over.
An explosive start is not critical (but it's handy to have), however the ability to ride at a consistently high speed is far more important. Many riders who go out too hard can look to be well up on their opponent, only to fade in the last 1000 metres. This has typically the greatest "cross-over" to the road. i.e. good pursuiters make good road riders and vice versa. Brad McGee, Stuart O'Grady, Vjatcheslav Ekimov, and Chris Boardman are a few examples of top pursuiters who have had successful road careers.

Every rider has a limit to his or her anaerobic and aerobic work capacities (and we can all work to improve them). However, come race day, the trick is working out how to best use your current capacities to ride the distance in the shortest time possible. Pacing is the key to success.
Let me demonstrate what I mean.

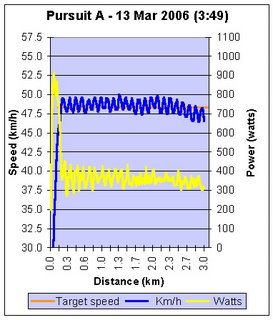
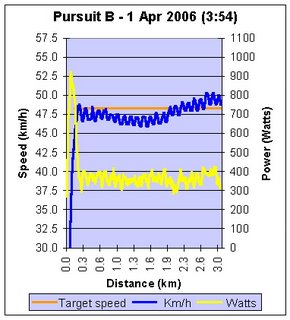
Below are three power and speed charts for Individual Pursuit efforts I have done over the last two months [1]. Apart from the public embarrassment, these charts highlight some really important lessons about pursuit pacing.
Each chart shows three lines:
  • The Blue line is speed - shown against the left axis in km/h
  • The Orange line is target cruise speed (in this case 48.3km/h)
  • The Yellow line is power in watts as shown against the right hand side axis.
The scaling is designed to make the comparisons easy to see and for the differences in pacing to stand out.


[1] Same rider, bike, set up, tyres & venue (an indoor velodrome); Data as recorded by Powertap; Conditions very similar (temperature, barometric pressure).
OK – the first thing you notice is the “sinusoidal" (up ‘n’ down) variance in the blue speed line as recorded by the power meter. This is due to the wheel speed variances caused when going from straights into the curves and back to straights. So you need to follow the overall trend of the blue line.
Secondly, you will notice the large spike in power output at the start, as the power is put down in order to accelerate from a standing start. Note the peak power of a little over 900 Watts before settling down to ride at an average of about 375 Watts.
Ride A is "almost perfect" pacing. Note how the start accelerated to the desired cruising pace, which was maintained through to the end (almost). Perfect pacing would have not seen a drop in pace at all.

Ride B shows a somewhat different pacing strategy.

In this case I started too conservatively, realizing half way that a lift in effort was both needed and possible, resulting in negative splits all the way to the finish (but too late to make use of all the petrol in the tank).
This ride represented a “missed opportunity” as clearly there was more speed available in the legs that day.
Looks like I was the April fool!
Ride C represents the classic pursuit pacing mistake - starting out hard (note peak power this time is well over 1000 watts and initial cruising power/pace is higher than the target) resulting in me being unable to maintain the effort, with the final laps an ugly experience, something I'm sure plenty of others who have ridden the event can relate to.
Now let’s compare the average power outputs with times:

Ride__ Avg Watts__ Time (3km)
__A__ 384 Watts__ 3:49
__B__ 388 Watts__ 3:54
__C__ 377 Watts__ 3:55


It is amazing to see that Ride A has a time 5 seconds faster than ride B but with slightly less average power!
Ride C is typical of many novice pursuiters (myself included). In my case I instructed my caller to use this pacing strategy as I wanted to find out what I really had in me on that day, knowing it was risky and the fact that even a personal best (PB) time was not going to qualify me for finals.
Ride B was my biggest disappointment as I clearly had the legs on the day to do a PB but simply didn't put it all on the line.
Ride A proves that with some practice, especially that crucial first lap and a half, perfect pacing is possible and a PB performance is just around the corner. Just try to hold back in the initial stages (but not too much!).
So how valuable is pacing strategy? Pretty important I would say. Anyone else out there want to knock 5 seconds off his or her pursuit time for no more actual effort?
It is easy to know the theory of perfect pursuit pacing but applying it is another thing altogether, so get to your local track and give it a blast. It’s the most fun on two wheels.
Happy pursuiting!
Alex

Read More......