I have also placed several horizontal lines on the chart to help. The power lines are at 200W, 240W and 280W, and the speed lines are at 38km/h, 40km/h and 42km/h.
We can see Rob rode about 35km total, with three intervals of ~10km each, with a bit of warm up and short recovery between each interval. So on that basis I decided to examine each 10km interval in more detail. The speed and average power for each interval was a little different, which each being ~ 20W harder and 0.7 - 1km/h faster than the previous effort.
Upon closer examination, it was clear to me Rob's air resistance (
apparent CdA*) varied during each 10km interval. Within each interval, there were four distinct sub-interval sections with relatively stable aerodynamics, each of approximately 2.5km in length. To see this properly requires re-plotting the data using a technique known as
virtual elevation, which helps us make aerodynamic sense of what can appear to be quite noisy data. I'm not going to show those charts as there are too many, but I will summarise the results into three charts, one for each 10km interval.
In each
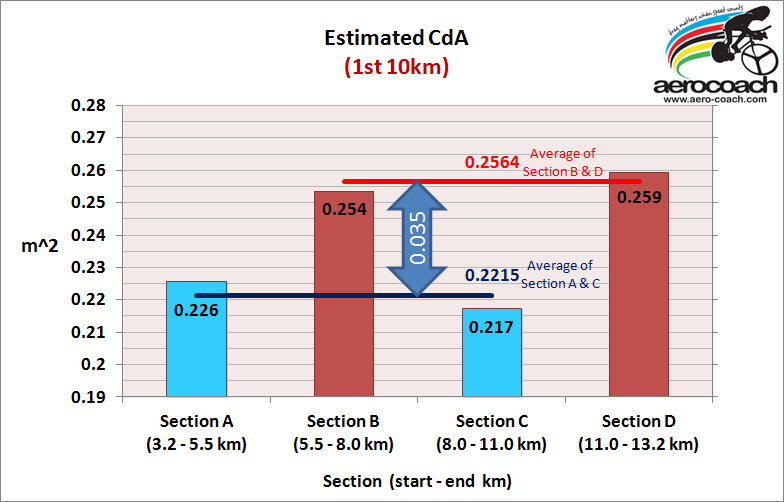
summary of results chart I have indicated on the bottom axis where I think the start and end of each of those sub-interval sections was, and the columns show my estimated CdA for each of those sections. Note that the CdA numbers won't be absolutely correct since I am making some other global assumptions about Rob and environmental conditions, but what's important is the measured differences in
apparent CdA. I may not have the absolute values exactly spot on, but the differences in the absolute values will be on the money. Here's the first summary chart:

You will see some blue and red columns, showing Rob's apparent CdA was either "low" or "high" during these sections. This can be as result for instance of being in the aero position, and then sitting upright, then back into aero again etc. But for the purpose of this exercise I know he rode with another rider on the track, and was either in front of, or behind the other rider. I didn't know how far the gap between the riders was in any of the intervals, all I am showing is the estimated difference in apparent-CdA between "leading" (red) and "drafting" (blue).
Also shown, are horizontal lines, which are the average apparent-CdA for "drafting" (blue) and "leading" (red), as well as the difference in apparent CdA between each (the fat vertical double headed arrow).
So we can see that the average difference in apparent-CdA for draft vs non-draft in the first 10km interval was 0.035m^2.
Here's the chart summarising the second 10km interval:

which shows an average difference in apparent-CdA between drafting and non-drafting of 0.033m^2, which is similar but slightly less than the difference measured in the first 10km interval.
And the third 10km interval:

which again shows a drafting benefit, but now that benefit has been reduced somewhat to 0.026m^2. There is also a slight increase in non-draft CdA in this interval compared to the first two intervals.
So in summary, the gain by drafting the other rider was a reduction in apparent-CdA of:
Interval 1: 0.035m^2
Interval 2: 0.033m^2
Interval 3: 0.026m^2
In terms of energy benefit for for Rob when drafting over leading, when riding at 40km/h this equates to wattage savings of:
Interval 1: 29W
Interval 2: 27W
Interval 3: 21W
What's interesting is that the non-draft CdA values are pretty consistent across all runs (a little higher in third interval), but that the draft-CdA values in the third 10km interval had increased somewhat more, IOW the drafting benefit had been reduced for some reason. There can be several reasons for this, such as environmental condition changes, on bike position changes due to riding at higher power and/or fatigue (creeping forward on saddle for instance), change in equipment/clothing and so on.
After I had done the analysis, Rob then revealed all the details of what he actually did - these are his words in green, although I have re-ordered some paragraphs for clarity:
The procedure was to ride sections of the interval drafting and non-drafting. It was attempted to hold a constant speed during each section (were aiming for 40kmh, but my front rider went a little slower on the first interval).
In all intervals I trailed on the first segment, then swapped to the front twice.
In all intervals I tried to hold the same aero position. This was very consistent on the first interval, but possibly less so on the final interval.
All intervals were the same draft distance +/- 0.3m, 12m front wheel to front wheel. A laser pointer was taped to the frame to aim at the back wheel of the rider in front for a 12m front wheel to front wheel distance. Rig checked after the session and laser was still accurate, so didn't move during the session.
The intervals got harder (3 x 10km E, M, H)
The wind went from dead calm to moderate on the H interval. Distinct head, tail and cross winds on interval 3 (the H one), possibly more than what Moorabbin airport recorded as there was a rain shower that came through with much stronger wind.
The other rider is small, ~65kg, on a very aero bike, in a good aero position. Probably 0.250m^2 or so CdA. If there was something smaller or more aero to draft off, it would be hard to find.
The BOM data for Moorabbin airport, 10km away approx was:
Date/Time EDT Tmp°C AppTmp°C DewPoint°C RelHum% Delta-T°C Wind PressQNH hPa Press MSL
hPa Rain since 9 am mm Dir Spd km/h Gust km/h Spd kts Gust kts -
08/06:00am 12.6 11.3 11.2 91 0.7 NNW 9 13 5 7 1010.6 1010.5 0.0
08/05:45am 11.9 11.4 10.6 92 0.7 NNW 4 9 2 5 1010.5 - 0.0
08/05:33am 11.5 11.6 10.2 92 0.7 CALM 0 0 0 0 1010.3 - 0.0
08/05:30am 11.5 11.6 10.2 92 0.7 CALM 0 0 0 0 1010.2 - 0.0
My weight and bike 95kg.
Crr previously measured many times on this velodrome at 0.0044.
Air density pretty consistent around 1.227.
Bike is TT (P3) with H3 front, H Jet Disc rear, eKoi helmet (no vents).
Track location is Carnegie Velodrome in Packer Park just near East Boundary Rd and North Road. 363m circuit.
Anyone suggesting there is no benefit at 12m is totally incorrect, even in head, cross and tail winds on interval 3 there was close to 20w difference - which is significant. When it is calmer, there is more benefit, which makes perfect sense.
There is also a high likelihood that there could be even more benefit that could be found from a bigger test rider in front, being 3rd or 4th wheel, or being closer than 12m.
So, there we have it. Even under the 12-metre rule the power savings from drafting are quite significant, and as Rob says, if you are following a larger rider, and add more of them into the line of riders on the road ahead, one can only imagine the power demand will reduce further. Not by as much as this initial benefit of course but it all adds up.
A larger rider adhering to the 12-metre draft rule when following a single smaller rider at speeds of ~40km/h in calm conditions gained a benefit of ~27-30W reduction in power required, and ~20W saving in moderate cross winds.
It's no wonder there are big problems with riders deciding they can go faster than the guy ahead, attempting to pass, and then being unable to maintain the pace because the power demand is still so much higher even with a 12-metre draft rule, creating all sorts of headaches for riders who find themselves stuck in drafting hell.
Aside from the drafting issue, this was a nice example of being able to correctly infer a lot from analysis of a naked power meter file, and with no specific prior knowledge of its content other than it was from a ride at a track somewhere looking to test the impact of drafting. OK, so it's not a formal scientific test, but I have to say, as a way of blinding one element of the analysis, this is a pretty cool outcome.
It's not the only time I've done this - I used this blind analysis technique to spot things like a rider's bike position changing during an event, as well as assess rider's physiological capabilities in events such as team pursuits.