
Well I've mentioned the PMC before and have alluded to TSS, CTL, ATL & TSB. Any more TLAs and I'll be working for the government!
So, just to show that the PMC is more than a few letters strung together in random order, here's a picture of one (click on the pic to see a larger, clearer version):
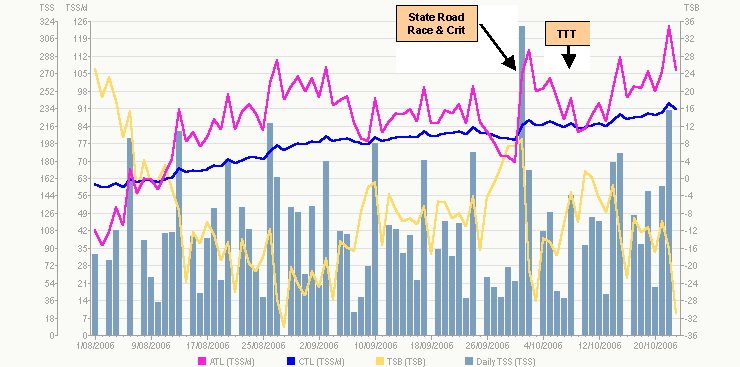
This chart covers my training since 1 August. There are four items charted here:
TSS:
The light blue columns represent the level of training stress each day as measured by TSS (Training Stress Score), which is calculated from both the overall duration and intensity of a ride. The harder you ride, the more points you score and of course the longer you ride the more points you score. So it is possible to score more TSS on a short hard ride than a longer easy ride (and vice-versa). This is all calculated from the data collected by the power meters on my bikes and by some clever maths built into the Cycling Peaks analysis software I use (although you can also do it in Excel).
You will note the consistent blocks of training each week, with one day per week with no riding at all. The tall columns are the longer weekend endurance rides or races, with typical time constraints keeping mid-week workouts down in TSS levels.
CTL & ATL
The next two items to note are the Blue (CTL) and Purple (ATL) lines. These represent a measure of Chronic Training Load (the accumulated amount of training load over the past couple of months) and the Acute Training Load (the amount of training load over the past couple of weeks). So these two lines show a trend of what I've been doing long term vs short term. (The maths behind the calculation of my daily CTL & ATL involves an exponentially weighted algorithm which I won't explain here).
In this chart you will see that the blue CTL line rises steadily, in my case at approximately 3.5 points per week for the period shown.
Note also that the purple ATL line is a little more up n down. This is because ATL weights your most recent training more heavily in the calculation than is the case for CTL, and so even one big day on the bike, or a day off, will have a bigger impact on your ATL than it will on CTL.
So what?
Well in order to get fitter, we need to continually provide a training stimulus in order to gain the adaptation required for our riding and/or racing goals. This is tracked very well by the blue CTL line, which basically equates as a measure of Fitness.
ATL on the other hand, since it is looking at your most recent training, is more a measure of your current levels of training fatigue. If you've been going hard lately, then your ATL will rise, but if you have a recovery week, then ATL will fall.
Have another look at my chart where I mark the State Masters Championship Road Race & Crit - see how my ATL falls in the week leading into the race as I have a short taper for the road race and coach had backed off my training.
TSB
Well with a reduced ATL I was quite fresh since my recent training was "easier" than what I had been accumulating long term. Hence the term, Training Stress Balance (TSB), which is the yellow line on the chart. So TSB is the difference between long term and recent training loads. Expressed mathematically it is simply:
TSB = CTL - ATL.
(A much simpler formula than used to calculate TSS, ATL & CTL).
Now this means of course that TSB can be either positive, negative or neutral.
Best performances are generally (but not always) associated with a positive TSB and hence it is desireable to plan training so that both CTL is high and TSB is sufficiently positive so that you have the two things that matter leading into an important event: Fitness and Freshness. Put these together and you will be going well.
Practical Example
So what about that race weekend? Well I went in after a steady build of my CTL, training was backed off in the week leading up to the race, which saw my ATL drop below CTL, hence going into positive TSB. In these circumstances, CTL falls a little as some "fitness" is sacrificed to be sufficiently rested and primed for the event.
The Result
In this instance I set new personal bests for Mean Maximal Power output for 60min to 2hrs, placed top-10 (7th) in a hilly road race (I'm no climber) and set an all time power PB and placed 4th in the crit. Very successful outcomes given I only had a 2 month build.
There are many uses for the Performance Manager, and assisting a rider/coach evaluate a build and taper strategy that works best is one of them. It provides the opportunity to "dial in" peak performance on any given day.
Pretty nifty, huh?
Want to know more?
Go here.
Monday, October 23, 2006
My Performance Manager Chart
Labels: Performance Manager, Training and Racing with a Power Meter
Posted by Alex Simmons at 7:45 pm
Subscribe to:
Post Comments (Atom)

1 comments:
Cheers. That made more sense than the Cycling Peaks explanation! :)
Post a Comment