Showing posts with label Aerodynamics. Show all posts

Saturday, July 23, 2016

Bemusing aero equipment choices at the Tour de France

2016 Tour de France. Stage 18 ITT Megève. GC contenders giving away time with bike set up choices. Why?

Here's the course profile:


Here's a table with the aero choices made by the 20 fastest riders on the day. As far as I can tell all rode using a skin suit (although some of the suits were not exactly a good aero fit). Note - I've updated Mollema's entry a few hours later as he was using a rear disk wheel.


Note: Rodriguez swapped from a time trial bike to a road bike part way along.

This suggests all these riders recognised that aerodynamics still mattered, but not enough that riders thought it worth using some other basic aero kit. Perhaps they felt there was too much of a weight penalty (there's not BTW). Or they did not feel good climbing on a TT bike, or were concerned with the descent? Lack of preparation is my take.

For reference, I used photos from the various websites to work out who used what. For front wheel and helmets, there might be a little debate as to it fits the category of aero or not. Needed to be a full aero TT helmet to count and what looked like low-ish profile wheels went in the "No" category. Always happy to amend if people spot errors.


Richie Porte, with not even an aero front wheel, let alone an aero helmet:


Fabio Aru, not much better:


Contrast with the stage winner Chris Froome who used all the aero aids at his disposal:


Images:
http://www.cyclingnews.com/tour-de-france/stage-18/results/

Average speeds for the top 20 ranged from 31.5km/h to 33.2km/h. Aerodynamics still matters quite a bit at such speeds. So why not take advantage of it?

Yes it was hilly but the lack of aero equipment choices for a TT even at these speeds does rather bemuse me. Weight penalty of helmets and wheels is negligible and any small benefits are outweighed by aero losses.

More discussion later. Perhaps.


Read More......

Monday, August 24, 2015

When your ride buddy becomes a real drag

A question that comes up from time to time when chatting about aerodynamics stuff is how much impact does another rider in close proximity have on your aerodynamics, or more correctly stated, does having another rider in close proximity change the power required for you to maintain your speed?

We are all familiar with the reduction in power required when riding behind another rider. This "drafting" benefit is substantial and anyone with a power meter can see the big reduction in power when they move from riding directly into the wind to riding behind another rider. Even if you don't have a power meter the difference is certainly large enough to notice the reduction in effort required.

But what about when your buddy is drafting behind you or rides beside you? Does this impact the power needed to maintain the same speed?

The short answer is: yes, both of them do.
But in what way and by how much?

The question as to whether a rider in front gains benefit from having a rider behind them has been researched before, and the consensus is that yes, they gain a small benefit. There is good reason for this slightly counter intuitive result and it's to do with the "bow wave" of air from the rider behind causing a change in the turbulent air flow behind the lead rider and reducing, by a small amount, the depth of the low pressure zone that exists behind the front rider.

This slight reduction in the fore to aft air pressure differential of the lead rider provides a small but measurable gain. This can be expressed as a reduction in apparent CdA, but since a rider's CdA doesn't really change if their position and equipment hasn't, then in reality it's a change in the forces acting on the rider, and as a result, the power demand at the same speed is slightly reduced when compared with having no rider in close proximity (or alternatively, a rider can travel slightly faster for the same power when they have a rider immediately behind them).

In 2010  Andy Coggan examined data from a 2007 track session ridden by his wife, in which she did efforts on the track both with and without having a rider drafting behind her. In Andy's assessment of the data he remarked "having a rider drafting closely behind them apparently lowered their CdA by 3.2%, i.e., from 0.198 to 0.192 m^2.".

The reduction in energy demand will be of a very similar amount to the reduction in apparent CdA. Assuming ~350W, a reduction from a CdA of 0.198 to 0.192 is equivalent to a reduction in power demand at the same speed of ~10W, or 2.8%. In this case the other rider was riding in pursuit set up, and were themselves very "aero" (an elite track pursuit rider).

So that's one example.

This phenomenon has also been reported in the published scientific literature, examples include:

Racing cyclist power requirements in the 4000-m individual and team pursuits, Medicine and Science in Sports and Exercise, v31, no.11, pp 1677-1685, 1999. J.P. Broker, C.R. Kyle and E.R. Burke.
http://www.ncbi.nlm.nih.gov/pubmed/10589873

where amongst their data they report that the lead rider requires 2-3% less power while riding on the front of a 4-man team than if riding solo at the same speed.

Another more recent study examined this using both computational fluid dynamics (CFD) simulations along with wind tunnel validation as described in this paper:
CFD simulations of the aerodynamic drag of two drafting cyclists, Computers & Fluids Volume 71, 30 January 2013, Pages 435–445,. Bert Blocken, Thijs Defraeyeb, Erwin Koninckxc, Jan Carmelietd, Peter Hespelf
http://www.sciencedirect.com/science/article/pii/S0045793012004446

In this paper they report the lead rider of two riders riding in single file receives a reduction in energy demand of 2.6% while riding in the time trial position.

Above are three examples of data from a similar situation, with reported reductions in energy (power) demand to ride at the same speed ranging between 2% to 3% for the lead rider compared with riding solo.

There's another paper that reports a 5% advantage for the lead rider of team time trial, although I'm not able to see more than the abstract:

Aerodynamics of a cycling team in a time trial: does the cyclist at the front benefit?; European Journal of Physics, Volume 30 Number 6, 2009; A Íñiguez-de-la Torre and J Íñiguez
http://m.iopscience.iop.org/0143-0807/30/6/014

Edit: I've now read the paper and it used two dimensional CFD analysis on ellipses as a simple model simulation of multiple riders in a line and is indicative of the principles involved.

I've had the resources to test this for some time but I've hadn't got around to doing the experiment, mainly because exclusive use of track time costs money and I'm focussed on working with clients on answering more important aerodynamics questions for them than doing experiments just for the fun of it.

But today I had the opportunity to do just such an experiment.

I was doing aerodynamics testing as part of a story being written about a woman masters rider preparing for the UCI World Masters track cycling championships being held in Manchester later this year. Cycling NSW kindly offered and arranged for the track time to make this possible, and a client of mine, Rod Wagner, loaned a special power meter to enable the testing on the rider's track bike, while I offered my time for the aero work.

We'd reached the end of our allotted track time, but as luck would have it no one else was ready to ride on the track, so we had some spare time for the experiment, and willing participants.

I won't comment on the primary aero testing session as that's for another to write about for later publication in magazine and online, but I'll expand on the impromptu experiment.

The method of measurement

With the Alphamantis Track Aero System, I record and monitor in real time a rider's aerodynamics as they circulate around the indoor velodrome. Testing is done indoors as this removes the wind variable and provides for a well controlled environment. The system enables us to monitor speed and velocity and along with other key inputs such as air density, track geometry data, centre of mass height, rider mass and rolling resistance variables, the Coefficient of drag x Frontal area (CdA) is also plotted in real time and lap by lap a picture of a rider's aerodynamics is revealed.

I've briefly explained this system before in this post, which also has a video demo. You can also read more on the Alphamantis site linked above.

The experiment

Normally this testing is done with a rider riding solo on the track but for this experiment I asked her coach, another world level master's rider, to join in. His task was to ride in various positions relative to the test rider (who would continuously circulate around the track at approximately 40km/h) while her coach would change his relative position on the track every 4-6 laps as follows and on my instruction, he would:

- ride in front of the test rider to test the level of drafting assistance, then
- ride next to, and on the outside of the test rider, then
- ride immediately behind the test rider, then
- drop off entirely and stop riding, so that we could obtain data from the test rider circulating solo.

This test process was repeated a second time during the long test run to validate the results from the first run.

For reference, the test rider is a slim 60kg female approximately 172cm tall, and the coach weighs approximately 80kg and is ~185cm tall. The test rider was using a track bike with pursuit bars, while the other rider was using a track bike in regular mass start set up.

The system is really reporting the impact on apparent CdA. It's a quick way to measure how beneficial or detrimental having the other rider near you is, and the measurements are not overly sensitive to the changes in speed during the run (this is the nice thing about the process).

The results

Here's a table summarising the results of all the data runs. Click on images to see larger versions.


In the case of the support rider riding behind the test rider, the test rider gained a benefit of a reduction in apparent CdA of around 0.008m^2, or about 3.8%. Note (i) the error range and (ii) the support rider was riding in a more upright mass start position (and consequently has a larger "bow wave") and is somewhat larger than the test rider.

Also shown are the results of the traditional drafting, being a reduction in apparent CdA to nearly half of the solo value, and interestingly, the apparent CdA increase of ~ 0.013m^2, or nearly 6% when the other rider was riding alongside the test rider.

Since apparent CdA differences are a little harder to understand, I've flipped the data around to show, at a normalised velocity of 40km/h, what the power demand for the solo rider would be for each scenario:


The table below summarises the chart data, and also shows the difference in power compared with riding solo:


Compared with riding solo, the test rider gains a ~7W (3%) benefit from having her ride buddy directly behind her; a 76W (39%) benefit from drafting behind her ride buddy; and a 10W (5%)  penalty when her ride buddy is riding alongside.

So in this experiment, I found a 3% energy demand benefit from having a trailing rider, and that's right in line with (but at the top of) the range found by the other reported data referenced earlier.

This result of a 10W penalty when riding alongside another rider is more novel, although it doesn't surprise me it may be news to some.

It is something to ponder when riding in team formation events, especially when the lead rider pulls aside to make their way to the back of the line of riders. They and their team are better off (at least in low yaw conditions) if the rider pulls over and moves well away from their companions until they are near the back and can return to be in the draft of the other riders. 10W is nothing to sneeze at.

Conclusion

So it would seem that if you wish to ride alongside your ride buddy, it might cost you ~10W give or take. If speed is of the essence, then ride in single file, you'll both go quicker that way.

Read More......

Friday, July 10, 2015

Aero for slower riders. Part II

A couple of years ago in this blog item I explained how there really aren't riders too slow to gain speed benefit from an aerodynamic improvement. I demonstrated how the same aero benefit actually resulted in greater time savings for slower riders over a fixed distance course.

That might seem counter intuitive to begin with, but it's simply because the relative speed gains are almost the same for everyone, and that the slower riders are on course for longer, thereby shaving more time from their ride.

Of course as I mentioned in my previous item the development priorities for every rider will be different, and whether or not spending time, effort, money or other resources on improving aerodynamics is a priority depends very much on your objectives and what your other development priorities are. Keep in mind it is possible to work on various aspects of performance simultaneously, it's not an either/or proposition.

That said, this is really just to cover the physics, which shows us that it really doesn't matter what level of rider you are, there is a speed benefit to improving aerodynamics, and the benefit is pretty much the same for everyone.

So here's the chart*:


It shows three sets of data. The lines plot the speed an rider would sustain on flat road at various power outputs from 100 watts to 400 watts. Put out more power, you go faster. That's pretty obvious.

I plot two of those lines, one each for a given coefficient of drag area (CdA) of 0.32m^2 and one for a CdA of 0.30m^2. Note that these CdA values are approximately midway between values typical for a rider of the size modelled on a road bike and position and a time trial bike and position.

A 0.02m^2 (6.25%) reduction in CdA is entirely possible with clothing, helmet and wheel choices. Of course it's also possible to attain such a drop from positional changes.

How much any individual can reduce their CdA depends on many factors, mostly how (un)aerodynamic they are to begin with. Some people have a greater opportunity for improvement than others.

In any case, the line with the same lower CdA shows a higher speed for each of the power outputs which is to be expected.

Below those lines I show with the red columns the proportional increase in speed attained from that 6.25% reduction in CdA. It ranges from 1.96% increase in speed at 100W to 2.09% increase in speed at 400W.

So while a faster/more powerful rider gains more speed from the same drop in CdA, the relative speed gains are pretty much the same at around 2% across a wide spectrum of power outputs.

OK, as I said last time, putting on some flash aero wheels and a skinsuit won't turn a local club amateur into a pro bike rider, but suggesting that a rider is too slow to gain speed from an aerodynamic improvement is nonsense.

And what's interesting is that all riders, be they fast or slow, benefit almost equally from the same aerodynamic improvement.


* And once again the data is derived using the same model as described in this paper:

Read More......

Tuesday, June 09, 2015

W/m^2, Altitude and the Hour Record. Part III

In my previous posts on this topic I explored the impact of altitude on the hour record. You can recap by clicking on the links here:

W/m^2, Altitude and the Hour Record. Part I
W/m^2, Altitude and the Hour Record. Part II

In summary, the primary impacts on the speed attainable (or distance attainable for an hour) are:

1. Physiological - the reduction in sustainable aerobic power as altitude increases due to the reduced partial pressure of Oxygen, and

2. Physical - the reduction in aerodynamic drag as altitude increases due to the reduction air density.

Of course there are other factors - variable track surfaces and geometry, logistical, financial, physiological and so on, but for the purpose of this exercise I have confined analysis to the primary physiological and physical impacts.


These primary competing factors - reduced power and reduced drag combine to mean that in general an increase in altitude means a greater speed is attainable. In other words, the benefit of the lower air resistance at higher altitude typically outweighs the reduction in power. But not always.

The level of impact to speed is individual and is a function of each individual's physiological response to altitude - while the physics side of the equation is the same for everybody. I covered this in more detail in Part II of this series, and used data from several studies which provide four formula for the average impact of altitude on power output.

I plotted the different formula depending on whether athletes had acclimatised to altitude or not.


This chart should be fairly intuitive - further up in altitude you go, the more power you lose compared with sea level performance. The vertical scale of the chart amplifies the differences between them, which are not large, but also not insignificant either. A key element was the difference between athletes that had acclimated to altitude and those who had not.

Then I layered on that the physics impact of reducing air resistance, but the resulting chart was not quite as intuitive to follow and so I decided to revisit this another way.

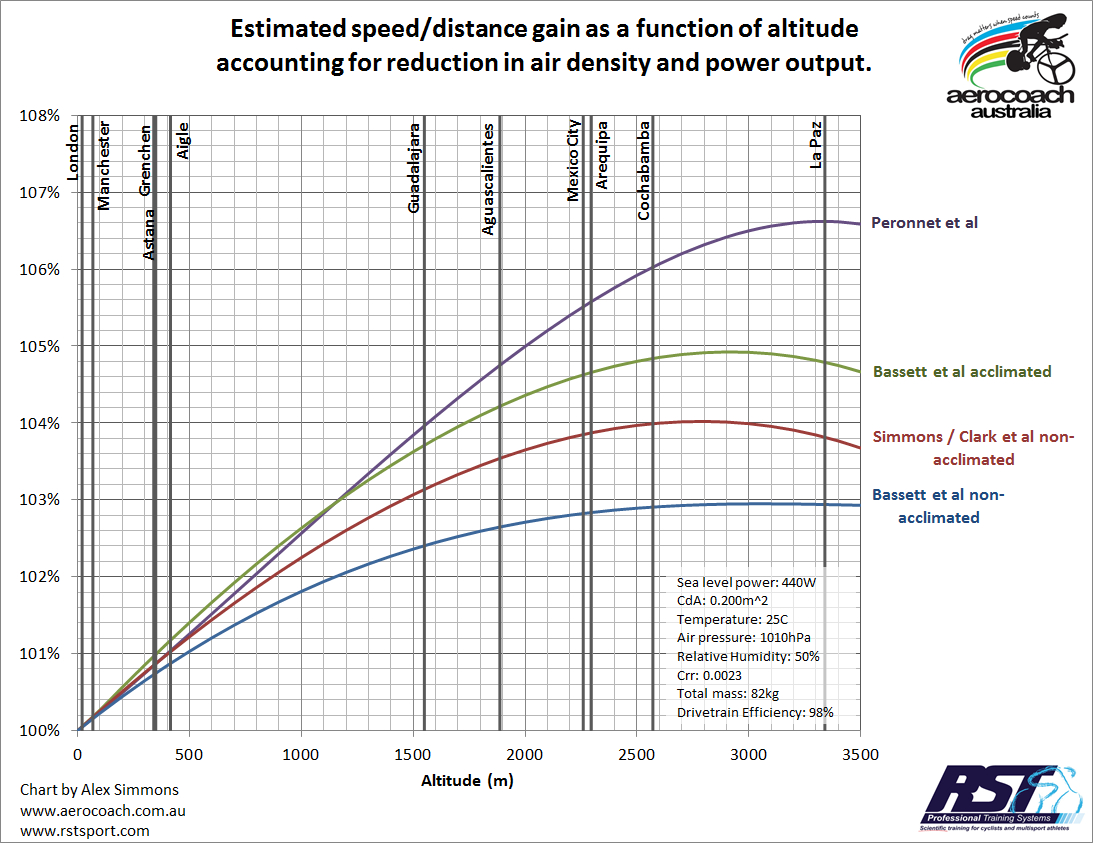
Hence exhibit A below (click on the image to view larger version):


This should be reasonably straightforward to interpret, but even so I'll  provide some explanation.

The horizontal axis is altitude and the dark vertical lines represent the altitude of various tracks around the world.

The vertical axis is the proportion of sea level speed attainable.

The curved coloured lines represent the combined impact of both a reduction in power using each of the formula discussed in Part II of this series, combined with the reduction in air resistance.

So for example, if we look at the green line (Basset et al acclimated), this shows that as an cyclist increases altitude, they are capable of attaining a higher speed up until around 2,900 metres, and any further increase in altitude shows a decline in the speed attainable, as the power losses begin to outweigh the reduction in air density.

The track in Aigle Switerland represents around a 1% speed gain over London, while riding at Aguascalientes would provide for between a 2.5% to 4% gain in speed. Head to Mexico City and you might gain a little more, but as the chart shows, the curves begin to flatten out, and so the risk v reward balance tips more towards the riskier end of the spectrum.

Altitude therefore represents a case of good gains but diminishing returns as the air gets rarer. Once you head above 2,000 metres, the speed gains begin to taper off, and eventually they start to reduce, meaning there is a "sweet spot" altitude.

Caveats, and there are a few but the most important are:
-  any individual's sweet spot altitude will depend on their individual response to altitude - the plotted lines represent averages for the athletic groups studied;
- the formula used have a limited domain of validity, while the plotted lines extend beyond that, a point I also covered in Part II of this series;
- these are not the only performance factors to consider, but are two of the most important.

I suspect that the drop off in performance with altitude might occur a little more sharply for many than is suggested here. Nevertheless, the same principles apply even if your personal response to altitude is on the lower end of the range, and it is hard to imagine why anyone would suggest that heading to at least a moderate altitude track is a bad idea from a performance perspective.

Alex Dowsett rode 52.937km at Manchester earlier this year. At Aguascalientes he could reasonably expect to gain ~3.5% +/-0.5%  more speed, or just about precisely what Bradley Wiggins attained in London.

Read More......

Monday, June 08, 2015

Density matters

I saw a question today from someone who read recent comments about how high air pressure resulted in Brad Wiggins' hour distance being less than it might otherwise have been with more favourable conditions.

He was wondering if you can control air pressure in velodromes, or choose a time of year when it is lower. So can we do that?

Climate control


While there are velodromes where the inside air temperature is controllable (mostly northern hemisphere tracks located in cold climates), the control of air pressure is not something possible at any currently existing track that I'm aware of.

It would require quite a deal of engineering, in particular to provide an air lock / sealed environment that enables lots of people (and service vehicles) to enter /exit the building without affecting inside pressures and which meets emergency evacuation requirements for a large crowd, as well as fresh air to breathe. I don't see that happening any time soon.

Air locks do exist, e.g. at Aguascalientes velodrome in Mexico they use an air pressure differential to support the roof, but that means the air pressure inside the velodrome needs to be higher than outside. Not by much, but it will always need to be higher relative to local weather conditions, and inside the velodrome air pressure will still vary relative to outdoors.

So what about picking a better time of year?


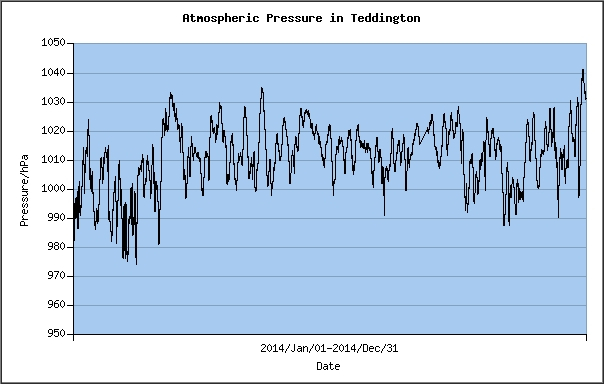
Well let's look at the daily barometric pressure readings near London for the past three and a half years. Source for these charts is the National Physical Laboratory in the UK.

Barometric pressure London Jan-Dec 2012

Barometric pressure London Jan-Dec 2013

Barometric pressure London Jan-Dec 2014

Barometric pressure London Jan-June to date 2015

Looking at the above, it's pretty clear there is no obvious pattern to suggest a time of year when barometric pressure will be, on the balance of probabilities, lower.

Air density is what matters.

Air pressure of course is not the only variable. What really matters is attaining as low an air density as is physiological sensible. Air density along with a rider's aerodynamics, ie. their CdA, determines the energy demand for riding at a given speed, and lower air density is desirable for greater speed, provided of course the means to achieve that lower density doesn't reduce a rider's power to the extent performance ends up being worse. e.g. by riding at such high altitudes or temperatures that the rider's power output is compromised to a greater extent than the air density benefit provides.

Air density is a function of:
- air temperature
- barometric pressure
- altitude
- relative humidity

You can pretty much discount the latter as the changes in air density is very small with changes in humidity, although for the record humid air is slightly less dense than dry air (at same temperature, pressure and altitude).

Air density reduces with increasing temperature and altitude, and with reducing barometric pressure.

Since attempting to reduce air pressure either via climate control or by picking suitable times of year is not really an option, that leaves us with adjusting the other two variables - temperature and altitude.

I've discussed altitude before in this item. I'm going to revisit it in a future post in an attempt to simplify the impact of the variables involved.

Heating the air inside a velodrome is common, and this was attempted with some powerful portable heating devices during Jack Bobridge's unsuccessful attempt earlier this year, and in the case of attempts at most northern hemisphere tracks, the temperature has been dialled up to the rider's desired level.

Wiggins did specific heat acclimation work and reports are the temperature inside the velodrome was around 28-30C. That's pretty warm - going too hot can be detrimental as power losses can occur with inadequate cooling. As I said earlier, it's a balance between a physical benefit and a potential physiological cost.

Read More......

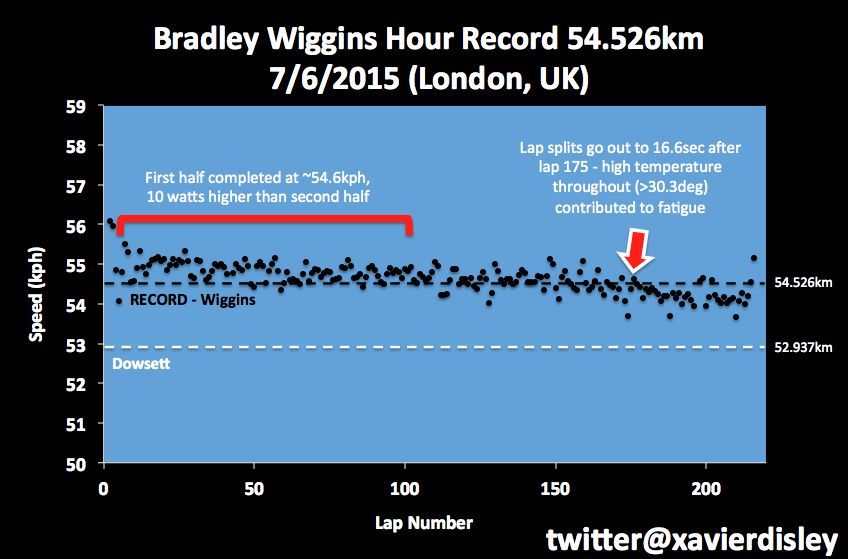
Wiggo's Hour

Just a short one today to update the chart from the one I posted here and on other social media forums. Click to see bigger version.


54.526km

Different reports of barometric pressure of 1031-1036hPa and air temp of 30.3C inside the track mean that Wiggins must have been exceptionally aerodynamic and recent work on his bike and position at the track suggest some good aero gains were made.

I estimate a power to CdA ratio of 2500-2550W/m^2 was required.

There are of course a range of assumptions:
Total mass: 82kg
Crr: 0.0023
Drivetrain efficiency: 98%
Altitude: 50m
Relative Humidity: 60%

If drivetrain efficiency is better, say 99% and Crr at 0.0020, then it drops the power to CdA ratio down to 2200-2220W/m^2.

and perfect pacing.

Just on that, my colleague Xavier Disley has once again produced a lap pacing chart - here it is:


That's a very slight fade over the course of an hour, which in my humble opinion is pretty much perfect. Opening few laps a bit hard, but that's understandable as a rider seeks to control the adrenaline rush with thousands in the crowd watching on and cheering.

The high air pressure did cost distance, and on another day perhaps 55km was within reach

As for going to high altitude, well there are many variables, but another 1-2km is feasible. See this item for more on that.

Well done to Brad Wiggins. That's sure a fine ride.

Read More......

Saturday, June 06, 2015

Pressure on the Hour

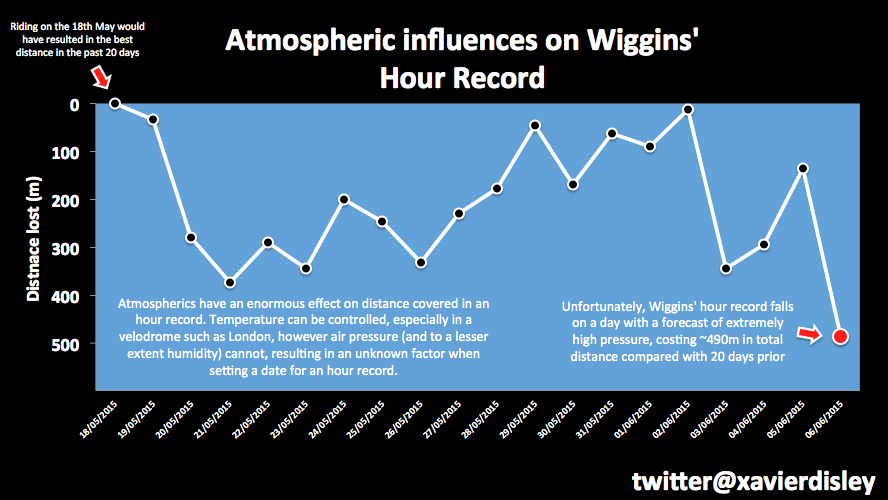
My colleague Xavier Disley did up a neat chart showing the impact the daily variability of barometric pressure can have on the distance attainable for an hour record, and how it's looking given the weather forecast when Xav last did the chart:


Nice - it shows how much breaking a record can still come down to a bit of luck with weather.

I think in Wiggins' case, assuming no major execution (i.e. totally crummy pacing) or mechanical issues, he'll break Dowsett's current mark no matter the weather as his power to drag ratio is sufficiently higher than Dowsett to overcome a slow air day.

But to set an outstanding mark such as Rominger's record, he'll need luck on his side. High pressure days are not good for speed.

Below is another version of this relationship between barometric pressure and distance attainable for four combinations of power and aerodynamic drag (CdA) values.


The chart is pretty self explanatory. For each combination of power and CdA chosen, the distance attainable reduces as barometric pressure increases.

That's because higher air pressure means a higher density of air molecules, and more air molecules to push out of the way requires more power.

A 60hPa difference in barometric pressure is equivalent to about 1km difference in distance attainable for the hour for the same power and CdA. That's a wide range of barometric pressure though, and variations are not normally quite that wide in most locations.

But a variation of half that is certainly possible over just a few days of varying weather as can be seen in Xavier's chart above.

I chose two power outputs: 430W and 450W, and two CdA values: 0.20m^2 and 0.19m^2. I don't know what Wiggins' power nor CdA value actually is or will be on the day, but for the sort of speeds he's likely to attain, these are in the ballpark.

It's the ratio of power (W) to aero drag coefficient CdA (m^2) that primarily determines the speed or distance attainable. hence why we refer to power/CdA ratio as measured by W/m^2. This chart covers a power to drag ratio range of 2150-2370 W/m^2.

Read More......

Friday, June 05, 2015

Where will Wiggo wind up?

Chart showing the progress of the UCI hour record since 1893 (click on it to view a bigger version):


The chart shows all the successful hour records recorded by the UCI. It doesn't show failed attempts.

The blue dots show the incremental increase in what is the absolute furthest distance attained.

The red dots show successful records for various categories of hour record but that did not surpass the furthest record for all categories up to that date.

For example, up until the early 1990s, the UCI had separate hour record categories for:
- amateur and professional riders
- above and below 600 metres altitude
- indoor and open air tracks

As a result, there were six categories of hour record for the period from about 1940 to the early 1990s.

And of course there have been bike/equipment regulation changes at times, most notably after Obree's and Boardman's records in the mid 1990s,

So where will Bradley Wiggins end up?


I'm pretty sure it'll be another red dot and not get close to Boardman's 1996 record and I doubt he'll beat Rominger's 1994 mark either. But he will likely beat Alex Dowsett's record (52.937km - the currently recognised record) by 1km or so.

I think anything above 54km will be very tough going. 54.5km perhaps if things go well. Closer towards 55km if everything is perfect.

Power 440-460W
CdA - who knows?

Say 0.200m^2.

Such a power range would net him around 53.5 - 54.4km at typical air density. 
On a low air density day that range would stretch to 54.5 - 55.4km. 

Weather forecast suggests low air density is unlikely although there is plenty of chat that they will raise the air temperature a lot, even up to 32C (yikes!).

So if velodrome air is heated to say 30C and air pressure is say 1020hPa, then at that power range and guessed CdA, the distance for a well paced effort will be in the 53.9 - 54.7km range.

Of course his CdA is the big unknown. Looks like he's been doing some work on it.

Drop that to 0.190m^2 and we can add about another lap (260 metres) to those estimated ranges.


Best of luck to Wiggo!

Read More......

Monday, January 19, 2015

Some kilometres are longer than others

With the spate of attempts at the UCI world hour record over late-2014 and into 2015 due to the revised UCI rules making the record within reach of more riders, it has naturally sparked interest in discussing what matters for best performance in the event.

Jens Voigt started the latest round of hour record attempts at the UCI's Aigle track
I recently saw some chat on a triathlon forum speculating about who could do what distance and so on. All in good fun, but none of them actually go to a track to find out. If they did, they'd realise it's not quite as simple (or as hard) as they might make out.

It pretty much comes down to optimising four main elements:
  • maximising sustainable power output for an hour
  • minimising the physical resistance factors of riding on the track
  • technical execution / skill
  • logistics & resources
Some might add psychological factors to that list, but ultimately I consider these to be expressed within the outcomes of each of the above.

Regarding logistics, there are of course UCI requirements to be permitted an official attempt an hour record, e.g.: minimum time in anti-doping bio-passport program is mandatory at elite level or dope testing at age group level, application submitted in advance for approval to relevant levels of cycling administrations, all the technical requirements including international level commissaires to supervise, a UCI approved track, use of timing equipment, start gates, specified date and time of attempt, etc. You can't just rock up and ride whenever you like. Well you could but it would never be a sanctioned attempt.

Then of course you need to factor in enough solo rider time on track for preparation, and that costs money and time as well. Quality indoor tracks are not always local, and even if they are, getting solo time on the track is not always so easy, let alone cheap. For an elite professional rider whose job is to race on the road, it may be difficult to devote sufficient time to the task of preparing properly for a track event.

Of course assuming the paperwork is all in order and you can do your training, then sustainable aerobic power and aerodynamics are king and the rider's ratio of power to aerodynamic drag area is the single most important factor for how far they will go in the hour. But W/m^2 is not the only factor.

There are other physical resistance force factors, like the influence of air density which is a function of altitude, temperature and barometric pressure (and to a much lesser extent, humidity) and the rolling resistance of the track and tyres chosen. I discuss some of these in the following items:
Altitude and the Hour record Part I
Altitude and the Hour record Part II

Which leaves us with technical execution and skill factors, of which there are a couple of key items, namely:


Riding good lines


Riding a good line involves a couple of components, one is pretty obvious and involves not riding further than you need to around the bends. Ride wide and you ride further. Pretty simple given the track is all but two semi-circles joined together with two straight sections. OK, the actual shape of tracks are more subtlety curved but that's close enough to describe why riding wide adds distance to your travels around a lap.

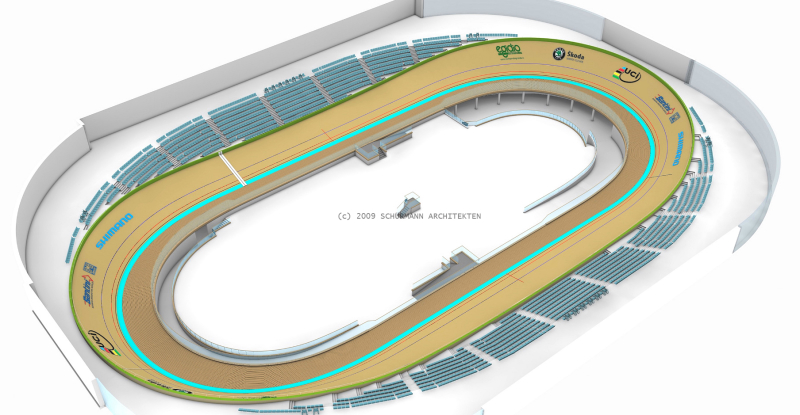
Design of the Glasgow Velodrome

If you ride 10cm wider in the turns, you add 10cm x 2 x PI = 62.8cm per lap.

If the extra width is measured on the track's surface, well the actual addition to the distance the wheel travels is reduced by the cosine of the banking angle. e.g. say the track's turns are, on average, banked at 40 degrees, and you ride 10cm above the black line. Then the actual additional track radius ridden is cosine (40 degrees) x 10cm = 7.7cm, and the additional distance per lap = 7.7cm x 2 x PI = 48.1cm. Nearly half a metre.

Do that over 200 laps or so for an elite hour record and you'll ride ~100 metres more than you need to. And that's for riding only a hand's width above the black line.

London Velodrome used for the 2012 Olympics
Another more subtle ride line factor involves the shape and design of the banking and in particular the transitions from the straights to the turns and back again, and whether it's advantageous to ride a slightly wider line in the straights to aid the transitions. On the straights you don't suffer the same severe distance penalty of riding a wider "radius" as you do when riding wide in the turns, so you can explore marginal gains in this manner.

However there is no simple or single answer to this, it depends on the rider and the track geometry - all of which have subtle differences. This is a somewhat more complex optimisation problem and I'm not going to delve into it here.

So putting aside these subtleties, the shortest distance around the turns is to ride the track's black measurement line* - ride any further out from the black line and you ride more distance each lap than is necessary. For the hour record you only get credit for the official lap distance each lap, which is typically 250 metres per lap on most modern standard indoor velodromes although some tracks are shorter and some are longer.

* it is possible to ride inside the black line, however in such timed track events like the hour there are foam blocks placed around the inside line of the track to ensure the riders don't. Very skilled riders can however ride fractionally under the black line on some tracks but it is risky as hitting the foam blocks can disrupt your effort and wash off some speed. The shape of the track in that small space between the black line and the wide blue section varies from track to track and it can be good or not so good to ride in.


Foam blocks discourage riders from riding inside the black measurement line.

Now why are some kilometres longer than others?


Office distance for the hour record =
(Official lap distance)  x  (Number of full laps completed within the hour)
+ a pro-rata distance calculated for the final incomplete lap

I won't go into the formula used by the UCI to calculate the pro-rata distance of the final lap (that's actually deserving of a blog post on its own as the regulations are remarkably confusing).

It matters not how far you actually ride, you'll only be credited with the official minimum lap distance per lap. This is why track riders and coaches are focussed on lap times and not with bike speed, since lap times are the integral of all performance elements. Power meter and other data loggers are of course valuable in parsing out the individual elements of performance that go into attaining lap times, and helping to prioritise development opportunities.

How good are riders at riding the minimum distance necessary?


It varies. Quite a lot. Skilled track riders are typically much better, which is what you'd expect. But what sort of penalty would an unskilled rider face if they started out on a track effort?

Of course we can do lots of maths to figure out how much extra distance on average a rider might cover if they ride wide by so much, but in reality riders move up and down the track, sometimes riding a good line, other times not so good. Some riders are just better at it than others and some adapt to the track more quickly than others.

It'd be so much better if we could simply measure what people actually do rather than speculate.

Which had me thinking. I have some data like that already...

Not so long ago I was doing some performance testing involving half a dozen pro-continental road racers at an indoor 250m velodrome. One of the features of the data logging system used for the tests is an ability to calculate the distance ridden per lap using the wheel's speed sensor data combined with track timing tapes to know precisely when they pass a specific points on the track. With some clever maths this is enough to nail the actual distance ridden each lap to high precision.

In amongst the test data were some solo efforts of at least 10% of the distance of an elite hour record attempt (i.e. 20+ laps of consistent effort) and several such runs by each of the six riders. I figured the runs needed to be long enough to reasonably approximate what a rider might be expected to do over a longer distance/duration.

Of course absolute accuracy of the distance the wheels travel depends on having an accurate wheel circumference value and that value not changing a lot while riding. So I'm not going to assume that the absolute accuracy was perfect, even though the absolute error might typically be somewhat less than 1%. More than that would require an error in tyre circumference assumption of 20mm, which is a lot for those used to measuring such things. However in our favour is that even if such an error existed, it would be a consistent bias error.

So rather than concern myself with absolute accuracy, I thought I'd compare the measured average lap distance for each run with the shortest recorded legitimate lap. In this way if there is any bias error, it's impact on this analysis is minimised (i.e. both measurements would be out by the same proportional amount). By legitimate lap, I mean a full lap not ridden below the black line.

Here's a table summarising data collected from the six riders (in no particular order). Each rider has multiple runs although I haven't identified the riders in the table. What the first column shows is the average lap distance per run less the minimum legitimate lap distance for that same run. The distances are of course distance travelled by the wheel.


Now the riders possibly could ride a tighter line than they actually did for their shortest legitimate lap, meaning that these distances likely underestimate the extra distance ridden when compared with riding very tight to the black line.

For the moment though let's assume the shortest lap they rode during each run was the best they are capable of doing. Since they actually did it, I think that's a reasonable assumption.

The average extra distance ridden per lap varies from one rider to another. One rider consistently rode only 0.3-0.4 metres more per lap than their shortest distance lap, while another was consistently riding more than 2 metres extra per lap on average compared with their shortest legitimate lap. The rider with smallest extra distance per lap had a track racing background.

The second column shows what that average extra lap distance would mean if extrapolated to riding 200 laps of a 250m track (an official distance of 50.000km). For one rider they would be riding nearly half a kilometre further than their track skilled team mate. Yet if both completed exactly 200 laps in the hour, each would be credited with riding precisely 50km, even though one rider's wheels had travelled nearly 500m further than the other's.

In this case, 50.5km = 50.0km. Some kilometres are longer than others.

So what's that extra 500m cost in power terms?


Well for a rider with a CdA of ~0.23m^2, that extra 500 metres travelled requires they output ~11-12 watts more than if they were able to ride a a better line.

Or they'd need to find a 3% reduction in CdA to make up for their skill deficiency.

Remember these were well skilled, well trained and experienced pro-continential road racers and finding an extra 10W or losing another 3% of aero drag coefficient isn't such an easy thing to do.

So no matter your current skill level and experience, if you're expecting to ride such an event yet you have never trained to become proficient riding on the track, well you might want to chop half a kilometre or so from your estimated distance covered based on your power and aero data alone.

Better still, just get to a track a find out what you can actually do.

Likewise, when estimating power, or W/m^2 from the official hour record distances, you might need to add some watts for the technical proficiency of the rider. The less proficient, the more power is required to attain the same official distance.


Read More......
Friday, December 19, 2014

W/m^2, Altitude and the Hour Record. Part II

The Physics recap


In an earlier blog post I examined the influence of altitude on the physics of cycling’s world hour record, and showed how the reduction in air density as altitude increases means one can travel faster for the same power output, or put another way, the power demand reduces at any given speed as altitude increases.
That resulted in this chart, which shows the relationship in power to drag ratio (W/m^2) for speeds ranging from 47km/h up to Chris Boardman's 56.375km/h record. I've slightly amended the chart to extend up to altitude of 3,000 metres. Click on the pic to see a larger version.


Each slightly curved coloured line represents a speed as marked, and from that you can see how the W/m^2 required reduces with increasing attitude. The chart clearly suggests there is an advantage to performing such record attempts at higher altitudes, but it's never that simple of course. 

And the Physiological impact...


As we climb to higher altitudes and air density drops, the "thinner" air also means a reduction in the partial pressure of oxygen, which negatively impacts the power output we can sustain via aerobic metabolism. That loss of power can be as much as 20% or more depending on how high we go, and our individual response to altitude.

So the gain in speed from the physics side of the equation is somewhat negated by the reduction in physiological capacity. But by how much, and what might be the optimal or "sweet spot" altitude for a cyclist seeking to set a new record?

The physics side of the equation is easier to predict than the physiological, since the physics applies equally to all, however individual physiological response to altitude is quite variable, both from person to person, but also depending on how well a rider has acclimated to altitude. There are even differences in how altitude affects elite versus non-elite riders.

There have been a few published papers examining the impact of altitude on aerobic athletic performance and from these formulas to estimate the loss of power as a function of altitude have been developed. There was one from the 1989 paper by Peronnet et al, two from the 1999 paper by Bassett et al, one each for acclimated and non-acclimated athletes. Adding to those, I have generated a fourth formula, based on the 2007 study by Clark et al. The relevant papers are:

Péronnet F, Bouissou P, Perrault H, Ricci J.:
A comparison of cyclists' time records according to altitude and materials used.

Bassett DR Jr, Kyle CR, Passfield L, Broker JP, Burke ER.:
Comparing cycling world hour records, 1967-1996: modelling with empirical data.
Clark SA, Bourdon PC, Schmidt W, Singh B, Cable G, Onus KJ, Woolford SM, Stanef T, Gore CJ, Aughey RJ.:
The effect of acute simulated moderate altitude on power, performance and pacing strategies in well-trained cyclists.

Peronnet et al used empirical data from actual world cycling hour records to estimate the impact of altitude on an elite cyclist's power output. The assumptions used in estimating altitude induced power loss may have some error; in particular due to methods used to estimate the power for each rider as neither the power nor coefficient of aerodynamic drag was actually measured.

According to the old Wattage forum FAQ item by Dr David Bassett, Jr, the two Bassett et al formula were derived from earlier papers examining altitude impact on aerobic performance of four groups of highly trained or elite runners. So while these formulas were not derived from cyclists we can still generalise from those to the loss of aerobic capacity for cyclists.

Finally, the study by Clark et al measured the impact on peak oxygen utilisation (VO2), gross efficiency and cycling power output on ten well trained but non-altitude acclimated cyclists and triathletes by testing riders at simulated altitudes of 200, 1200, 2200 and 3200 metres. They examined a number of factors, including maximal 5-minute power output, VO2 and gross efficiency relative to performance at 200 metres, as well as sub-maximal VO2 and gross efficiency.

I used these data to generate a formula similar to those from Peronnet et al and Bassett et al. Of course there is an assumption of an equivalent reduction in 1-hour power as for 5-minute power. Clark et al noted slightly greater reductions in VO2 peak than for 5-minute maximal power, and no change in gross efficiency at 5-min max power with altitude. So there is some anaerobic metabolic contribution presumably making up the difference. There was some loss of sub-maximal efficiency noted at a simulated 3200 metres.

I chose in this instance to use the reduction in 5-minute power rather than fall in VO2 peak as the base data for the formula, and applied an adjustment to offset the formula for sea-level equivalency to bring it into line with the formula by Peronnet et al and Bassett et al. Of course when you look at the reported data there are of course sizeable variations within the test group at each simulated altitude, so the formula is based on group averages for each simulated altitude.

Here are the formulas:

x = kilometres above sea level:
Peronnet et al:           
Proportion of sea level power = -0.003x3 + 0.0081x2 - 0.0381x + 1
Bassett et al Altitude-acclimatised athletes (several weeks at altitude):
Proportion of sea level power = -0.0112 x2 – 0.0190x + 1
R2 = 0.973
Bassett et al Non altitude-acclimatised athletes (1-7 days at altitude):
Proportion of sea level power  = 0.00178x3 – 0.0143x2 – 0.0407x + 1
R2 = 0.974
Simmons’ formula based on Clark et al:
Proportion of sea level power  = -0.0092x2 – 0.0323x + 1
R2 = 0.993


So how do each of these estimates of power reduction at altitude compare? Well here's a plot of these formula:


There is some variance between each formula's estimates, although the gap between the Non-acclimatised athlete estimates by Bassett et al and by Simmons based on Clarke et al is not all that large, ranging up to a ~2% variance. 

Had I chosen to use the reduction in peak VO2 for 5-min max power, then I'd expect those two lines to be closer. In any case, these data by Clark et al reasonably match earlier reported findings of the impact of altitude on sustainable aerobic power. And once again - the individual response varies - these are simply averages based on the limited data available and for the cohorts tested. As always, YMMV.

The formula by Peronnet et al is the least aggressive at reducing the estimate of a cyclist’s power at higher altitudes, and that may be due to various not insignificant assumptions used in calculating each rider’s power outputs.

OK, so now we have estimates of both the physics upside and the physiological downside of altitude, What happens when we merge the two?


Well if I recreate the chart showing the physics, and overlay on that the curve showing power output as a function of altitude, this is what we get if we examine a rider capable of sustaining 51km/h at sea level:


Let me explain how to interpret the chart.

First of all, the vertical axis scale has been changed for clarity – the slightly curved coloured lines still represent the power to drag ratio required to attain a given speed at various altitudes.

So let's examine the case for a rider capable of sustaining 51km/h at sea level.

The thick orange line represents the power to drag required to sustain 51km/h. At sea level that's ~1,800 W/m^2 (Red circle 1). The exact value depends on a few other assumptions of course, so let's just use that as our "baseline" W/m^2 value.

Now if we apply the Bassett et al formula for power reduction for an altitude-acclimatised athlete, then their baseline sea level power (and with it their power to aero drag ratio) falls with increasing altitude. This drop in sustainable power with increasing altitude is indicated by the black dotted line.
We can see the power to drag ratio resulting from the physiological impact of altitude (the dotted black line) doesn't fall as quickly as the power to drag ratio required to sustain 51km/h (the thick orange line).

If you trace the black dotted line from left to right, we can see that at Red Circle 2, the power to drag ratio crosses the line marked 52km/h at an altitude of ~700 metres. Then as you trace the dotted line further to the right, we can see it cross the 53km/h line at ~1,500 metres. Tracing the line to the right hand edge of the chart out to 3,000 metres altitude, we can see it doesn't quite reach the 54km/h line, falling a little short at 53.9km/h. So for this altitude-acclimatised athlete, they can gain an extra 2km on their hour record simply by choosing to ride at an altitude of 1,500 metres.

OK, so what happens if the athlete is not acclimatised to altitude?


This time the non altitude-acclimatised power line is indicated by the lower black dashed line. It starts at 1,800 W/m^2 at sea level indicated at Blue circle 1, but as we trace that line to the right, it falls away more quickly than for the altitude-acclimatised athlete, crossing the 52km/h line at ~1,000 metres altitude (Blue circle 2) and not reaching the 53km/h line by the time the athlete is at 3,000 metres, where in this case the athlete would be estimated to achieve a speed of ~ 52.9km/h (Blue circle 3).

So while the acclimated athlete can improve their speed by 1km/h by going from sea level to 700 metres, and increase speed by 2km/h by going up to 1,500 metres, to achieve the same speed gains the non-acclimated athlete would need to ride at an altitude of 1,000 metres and would not be able to attain a 2km/h speed gain even at 3,000 metres.

We can see that as the altitude increases, the extra speed gains begin to diminish, and there are risks in going too high, especially if you are not acclimated, or experience an above average decline in power with altitude.
Conversely, if you are well acclimated and/or have a below average decline in power with altitude, then there are benefits in going higher if maximising speed is your primary objective.

Any rider considering an hour record would do well to consider the opportunity presented by tracks located at altitude. Of course costs, logistics, regulations all factor into the choice of venue, and how much time a rider may need to acclimate to altitude, and their individual response to altitude.

If a sea level based rider were considering a fly-in / fly-out attempt without much acclimation time, then I'd suggest choosing a good track that is not too high, as the risks of a larger than expected power decline increase significantly, and the potential speed gains diminish as well increasing complexity of execution as nailing pacing gets trickier. Of course the more experience a rider has with altitude and its impact on their performance, the more confident they can be with predicting an ideal location.

So what tracks are there at altitude?

Indoor laminated wooden 250m tracks at altitude include:
  • Aguascalientes, Mexico: 1,887 metres above sea level
  • Guadalajara, Mexico: 1,550 metres above sea level
  • Aigle, Switzerland: 415 metres above sea level
  • Astana, Kazakstan: 349 metres above sea level
  • Grenchen, Switzerland: 340 metres above sea level
There are track at much higher altitudes, but they are 333 metre outdoor tracks with concrete surfaces:
  • La Paz, Bolivia: 3,340m
  • Cochabamba, Bolivia: 2,571m
  • Arequipa, Peri: 2,295m
  • Mexico City, Mexico: 2,260m
Of the above listed tracks, Aguascalientes is a venue well worth considering. Eddy Merckx's October 1972 hour record of course was set in Mexico City, as were Francesco Moser's two hour records in January 1984. Most hour records since then have been set at or near sea level, with the recent rejigged rule records set by Jen's Voigt and Matthias Brändle at the Aigle and Grenchen tracks in Switzerland respectively.

So what's actually possible by the bigger guns of the sport. e.g. Wiggins, Martin, Bobridge and company?


I'll save that analysis for a future post, as well as a look at generating a formula to estimate the range of potential speed gains as a function of altitude, given an estimated sea level performance.

Read More......
Thursday, December 11, 2014

The sum of the parts II

Warning. Bike geek talk follows involving maths and physics, although I'll spare you the calculations and just provide the charts summarising the outcomes.

In this February 2013 post "The sum of the parts", I discussed the relative importance of wheel mass and wheel aerodynamics during accelerations using a technique known as forward integration, and based on the mathematical model of road cycling power by Martin et al.

As I said back then, aero and weight are not the only wheel performance factors to consider, but these are the two I am going to examine here, since  they are the two factors most often conflated with respect to their relative importance. Read my earlier post for a long list of other factors to consider.

In that item I made some assumptions about the scenarios being compared and said I would return one day with an updated version using better assumptions applied to the forward integration model.

I’ve now had the chance to do the revised modelling, and I was prompted by some recent forum postings once again promulgating the wheel rotating mass is really important myth, since it’s an often misunderstood concept.

So I’m going to run some numbers through the model for three scenarios:

  1. A standing start acceleration lasting 10-seconds on flat windless road,
  2. A rolling start acceleration lasting 10-seconds from an initial speed of 30km/h
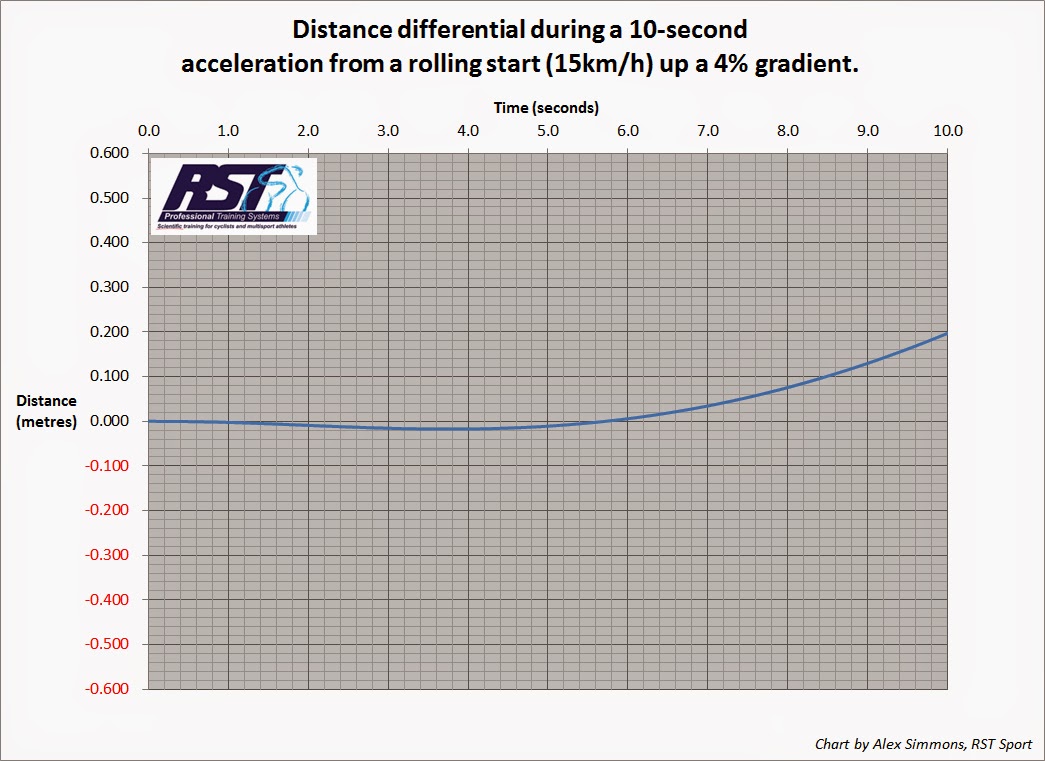
  3. A rolling start acceleration lasting 10-seconds from an initial speed of 15km/h and heading up a 4% gradient

For the first I will examine the impact of adding mass to the wheel rims, and then for each when adding that extra rim mass comes with an aerodynamic benefit.

This time I have added extra features to the model to improve its realism. These are:

i. Including calculation of the rotational kinetic energy of the wheel in the model. Previously I had simply overstated the wheel mass difference as a (not unreasonable) means to compensate for not including a calculation of changes in rotational kinetic energy.

ii. Using a power curve in each scenario that is more realistic. In the original model I used a flat 1000W power curve, but of course no one generates power in such a manner. So this time I used power curves for a standing start and a rolling acceleration based on sample accelerations from my own (post amputation) data.

Rotational Kinetic Energy demand of accelerating wheels is small


The amount of additional energy or power required to accelerate a heavier rim at the same rate is very small, but nonetheless, I added it to the model for the sake of completeness. In this revised model I only considered the case of adding extra mass at the rim, since this is the “worst case scenario” for adding wheel mass, and happens to also be easier to calculate the moment of inertia.

If you want to really examine the difference between two wheelsets, you'd need to know the moment of inertia of each wheel, but it will always be less than if all the extra mass is added at the rim.

So just how much is the difference in energy demand from adding extra mass at the rim?

Well if you consider a 5-second long acceleration of an 80kg road bike + rider on a flat windless road from 30km/h to 40km/h, it requires a 5-second average power of over 700W. Adding 250 grams to the wheel's rims will require a whopping extra 2.7 watts to attain the same rate of acceleration, of which half is the additional power required for the translational (linear) acceleration component, and half for the wheel's rotational acceleration component.

Like I said, the extra energy demand to accelerate additional rim mass is not much. But every little bit counts. Sum of the parts.

Standing Starts


So let’s begin with the standing start scenario (i.e. an acceleration from 0 km/h).

How much does adding 250g to the rim affect acceleration?

Well here are the model assumptions comparing each set up:


Below is shown the respective speed curves if we apply a standing start power curve typical for me, i.e. power rises quickly to a little over 1000W after 2.5-seconds, holds near that level for about 5-seconds, and begins dropping away after ~8-seconds as neuromuscular fatigue sets in. For reference, the 10-second average power as shown is 924W. You can click on the image to see a larger version.


The difference in speed curves for each scenario is almost impossible to discern - there are actually two speed curves but they overlap very closely, hence appear as only one.

So in order to assess the differences, I plot the difference in cumulative distance travelled at each moment in time. In other words, this chart plots how far ahead or behind the second set up (heavier rim) is after X seconds.


We can see the addition of extra mass at the rim reduces the acceleration slightly and after 10-seconds there’s a loss of 22cm compared with using the lighter rim. Cool, let's all rush out to get lighter wheels. Well, just hang on a minute...

Heavier but with better aerodynamics


As mentioned in my previous post, I’ve already shown a drop in CdA of 0.023m^2 in low yaw conditions between using a set of low profile spoked wheels, and a deep section aerodynamic wheelset. But you don’t need to believe me, there is plenty of wheel test data in the public domain, for example the one done many years back by Roues Artisanales showing the power absorbed for various wheels. For good aero wheels, the advantage increases significantly in cross winds. There are many other wheel aero tests available, and Jack Mott of Aeroweenie has put together a neat list of such datasets.

So what happens if that extra 250 grams of rim mass comes with an aerodynamic bonus reducing CdA by 0.023m^2?


Since the plot of speeds still shows very little discernible difference, and I’m applying the same power curve, I’ll go straight to the cumulative distance difference chart:


Initially the lighter wheel takes an advantage and gradually pulls ahead of its heavier but more aerodynamic rival, gaining a maximum advantage of 5cm after 5-seconds. However, as the acceleration progresses, the bike/rider with the heavier but more aero wheel begins to catch up, draws level and passes the light wheel rider after 8-seconds and finishes the 10-second effort with an advantage of 11cm.

So, not a lot in it, but remember that this is a standing start scenario, which is the quickest acceleration scenario there is on a bike, and where the impact of wheel rim mass has the greatest (albeit minimal) impact on performance.

In my previous post using simpler model assumptions I said that the lighter but less aero wheel set was good for a standing sprint of up to six seconds. Well with a power curve that’s a little more realistic (for me), that advantage extends to all of eight seconds. Beyond then and it won’t matter, the bike/rider with the heavier but more aero wheel will pull away. And the greater your standing power curve, the earlier the advantage tips to the aero wheel.

Rolling accelerations


OK, so what about accelerations from a rolling start? Well you should be able to guess the outcome of this one before reading on.

Here are the power and speed curves for a rolling start sprint effort.


In this case you’ll note that the peak power is higher than for the standing start, closer to 1250W occuring again after about 2.5 seconds (and incidentally sees me add about 1000W above the baseline effort of ~250W), but thereafter drops away consistently. This sort of power curve is normal for me from a rolling start as I can get pedal speed higher and more rapidly but I also experience a quicker decline from that peak than in the standing start. 10-second average power in this scenario is 989W (about 65W higher than the standing start).


Here’s is the cumulative distance difference:


The bike/rider with the heavier but more aero wheel pulls ahead as soon as they start their sprint and never looks back, ending up with a 58cm advantage after 10 seconds, or nearly a full wheel ahead.

Now of course the assumption with these comparisons is that all other properties of the wheels are the same, even so my original conclusion stands, even in races with hard accelerations.

The model can be run with anyone’s individual power curve, mass, CdA and Crr assumptions, as well as considering other factors such as gradient and wind.

Hotdog crit anyone? Sprint up a hill?


Let’s say we have the same bike, rider and wheel sets as above but this time the acceleration begins from only 15km/h and goes up a 4% gradient. Nasty.


Here the lighter wheel gains a maximum advantage of just under 2cm after 3.8 seconds, thereafter the heavier aero rim catches back up after 5.7 seconds and ends the 10 seconds sprint 20cm ahead.

If the finish line were 90-100m or more from the turn, I sure know which wheel I’d prefer to be using. If it was only 45 metres though, well it’d sure be a tight race and you'd need a high speed finish line camera to pick the winner!

Keep it steady son!


OK so the point of all this was to demonstrate the relative unimportance of wheel rim mass and why aerodynamics matters even when accelerating, as dynamic scenarios are somewhat harder to calculate than steady state cycling scenarios such as time trialling, or hill climbing where accelerations are very small and changes in rotational kinetic energy are zero, or so tiny as to be completely negligible.

For steady state cycling, well the heavier but more aero wheel still wins in just about every scenario.

For the rider in this set of examples, at 300W the bike/rider with the heavier but more aero wheel still climbs faster on gradients of up to 8%, and of course will descend more quickly as well. At 9% gradient it's line ball and once you go steeper than that, well the lighter rim is quicker.

Read More......