Sunday, July 26, 2015

Alpe d'Huez: TDF Fastest Ascent Times 1982-2015

Update of the Alpe d'Huez climbing times and speed chart previously posted here and here. Read those previous posts for discussion of context.

Edit (28 July 2015): since posting this two days ago, I was alerted to some updates made to the 1991 ascent times. Two sources did work with archive video to better verify these times, the net result being an addition of 41 seconds to each of the 1991 ascent times.

Thanks to https://twitter.com/ammattipyoraily for the posting the data.

This chart shows the average speed of the five fastest ascents up the Alpe d'Huez climb for each year the Tour de France included this climb, with the exception being the times from the 1980s which are the average speeds for fewer riders (as data on five fastest ascents in those years is not available to me).


As a reminder, I chose to average the 5 fastest ascent times for a couple of reasons:
- it reduces the individual noise in the data for year by year comparisons
- the 5 fastest were most likely to have been giving it close to maximal effort and would be representative of the quality at pointy end of the field
- the available historical data I have on ascent times doesn't permit increasing that sample size all that much in any case.

 Here's the data in table format, along with some extra context information. I've also ranked the average ascent speeds of the 5 fastest for each of the 13 occasions during 1991-2015 that Alpe d'Huez was climbed. I left out ranking 1980s ascents as I don't have times for all 5 fastest riders for those years (IOW the actual average speed of 5 fastest would be lower).

As we can see, 2015 ranks as the 8th fastest TdF ascent over that period, when based on the 5 fastest ascents each year.


Here's the same table but with weather conditions for the airport nearest to Boug d'Oisans listed from 3pm to 5pm on the day of the race. I was only able to source data back to 1997. If anyone knows of an online almanac of weather data for near Bourg d'Oisans for years prior to 1996, please let me know.

Weather data source: http://www.wunderground.com/
Note the variability in temperature from year to year, and importantly the prevailing wind direction and speed. 

Now how such prevailing wind actually plays out on the slopes of the Alpe is hard to say, but we should expect some differences from year to year in the speed riders can attain given their power on the day.

Or put another way, any power estimates from ascension rates comparing year to year will have some error depending on how the localised wind plays out. The climb obvious has many changes of direction, and wind at rider level is different to the prevailing conditions (normally measured at 10m above ground level and as a rough estimate it's about half that at rider level). Of course localised wind will be shaped by the Alpe itself as well as boundary layer features such as trees, road cuttings, vehicles and so on.
Map: http://www.alpedhueznet.com/


The prevailing wind was from the North East in 1997, 1999, 2008, 2011 and 2015; from the North West in 2003 and 2013; from the South West in 2001 and 2006 and from the West in 2004.

Course profile shows the climb is not a constant gradient:
Source: http://bike-oisans.com/wp-content/uploads/2013/02/profil-montee-alpe-d-huez.png


Fastest five ascents up Alpe d'Huez from this year's stage were:


and here are the fastest 5 riders by year (click to see larger version), with lines marking the time of the 50th and 100th fastest ascents of all time:


Read More......

Friday, July 17, 2015

Climbing power estimates: Windbags II

No specific comment, I just wanted to create a public link to the following 2014 study investigating the accuracy of climbing power estimates and to include a graphic and quote the study's conclusion.

My earlier comments on this topic of estimation accuracy can be found in this post from two years ago:
http://alex-cycle.blogspot.com.au/2013/07/windbags.html

The study is:
Accuracy of Indirect Estimation of Power Output From Uphill Performance in Cycling 
Grégoire P. Millet, Cyrille Tronche, and Frédéric Grappe
International Journal of Sports Physiology and Performance, 2014, 9, 777-782 http://dx.doi.org/10.1123/IJSPP.2013-0320 © 2014 Human Kinetics, Inc.

Link:
http://www.fredericgrappe.com/wp-content/uploads/2015/01/Millet.pdf


Study Conclusions:

Aerodynamic drag (affected by wind velocity and orientation, frontal area, drafting, and speed) is the most confounding factor. The mean estimated values are close to the power-output values measured by power meters, but the random error is between ±6% and ±10%. Moreover, at the power outputs (>400 W) produced by professional riders, this error is likely to be higher. This observation calls into question the validity of releasing individual values without reporting the range of random errors.

Read More......

Friday, July 10, 2015

Aero for slower riders. Part II

A couple of years ago in this blog item I explained how there really aren't riders too slow to gain speed benefit from an aerodynamic improvement. I demonstrated how the same aero benefit actually resulted in greater time savings for slower riders over a fixed distance course.

That might seem counter intuitive to begin with, but it's simply because the relative speed gains are almost the same for everyone, and that the slower riders are on course for longer, thereby shaving more time from their ride.

Of course as I mentioned in my previous item the development priorities for every rider will be different, and whether or not spending time, effort, money or other resources on improving aerodynamics is a priority depends very much on your objectives and what your other development priorities are. Keep in mind it is possible to work on various aspects of performance simultaneously, it's not an either/or proposition.

That said, this is really just to cover the physics, which shows us that it really doesn't matter what level of rider you are, there is a speed benefit to improving aerodynamics, and the benefit is pretty much the same for everyone.

So here's the chart*:


It shows three sets of data. The lines plot the speed an rider would sustain on flat road at various power outputs from 100 watts to 400 watts. Put out more power, you go faster. That's pretty obvious.

I plot two of those lines, one each for a given coefficient of drag area (CdA) of 0.32m^2 and one for a CdA of 0.30m^2. Note that these CdA values are approximately midway between values typical for a rider of the size modelled on a road bike and position and a time trial bike and position.

A 0.02m^2 (6.25%) reduction in CdA is entirely possible with clothing, helmet and wheel choices. Of course it's also possible to attain such a drop from positional changes.

How much any individual can reduce their CdA depends on many factors, mostly how (un)aerodynamic they are to begin with. Some people have a greater opportunity for improvement than others.

In any case, the line with the same lower CdA shows a higher speed for each of the power outputs which is to be expected.

Below those lines I show with the red columns the proportional increase in speed attained from that 6.25% reduction in CdA. It ranges from 1.96% increase in speed at 100W to 2.09% increase in speed at 400W.

So while a faster/more powerful rider gains more speed from the same drop in CdA, the relative speed gains are pretty much the same at around 2% across a wide spectrum of power outputs.

OK, as I said last time, putting on some flash aero wheels and a skinsuit won't turn a local club amateur into a pro bike rider, but suggesting that a rider is too slow to gain speed from an aerodynamic improvement is nonsense.

And what's interesting is that all riders, be they fast or slow, benefit almost equally from the same aerodynamic improvement.


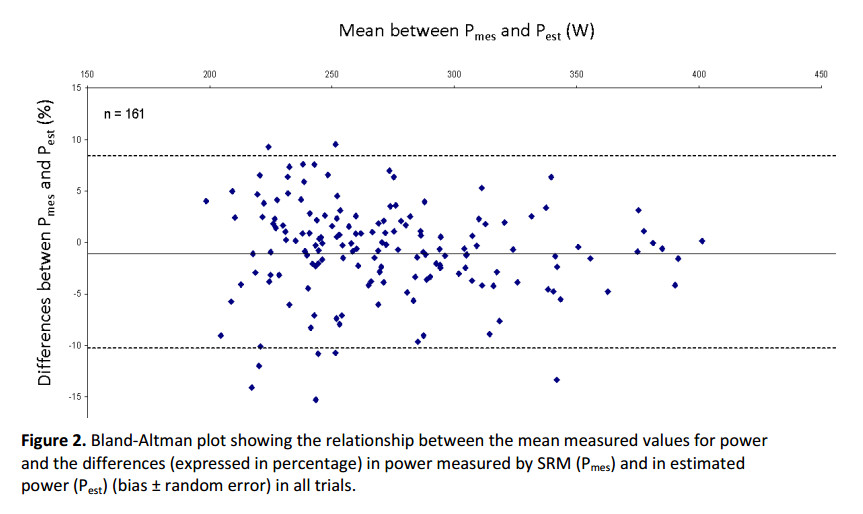
* And once again the data is derived using the same model as described in this paper:

Read More......