Wednesday, May 20, 2009

Crocs, toads & mozzies...


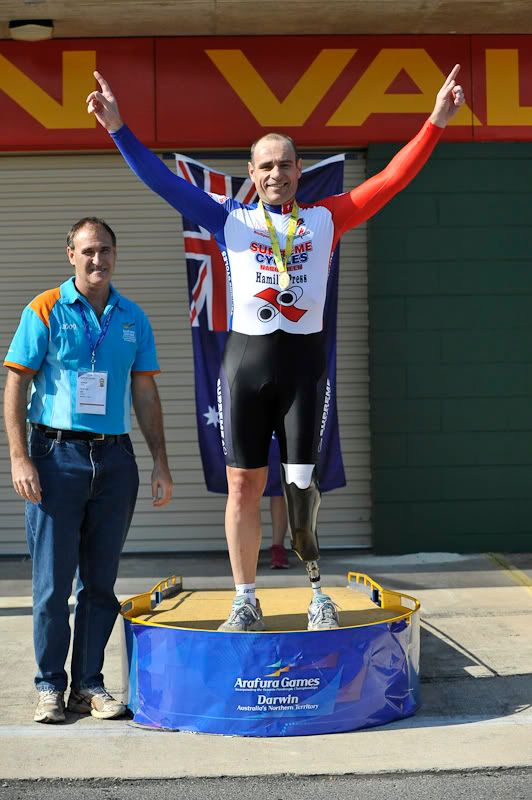
OK, my first "season" is done. I finished it off with a trip to Darwin, in Australia's Top End, to compete in the Oceania Para-cycling road championships.

I finished that event with Gold medals in both the Time Trial and the Road Race for the LC2 category.

I also picked up a few dozen mozzie bites for my trouble, which have been persistent little buggers, itching for quite some time since getting home.

A few things about Darwin have changed in the 15 years since I lived there in the mid-1990s (but not all that much really - certainly not as much as locals would have you believe).

Firstly, you now see dead cane toads on the road. Next thing is part of the reason why you see dead cane toads on the road is because everyone is busy looking at the personalised numbers plates which seem to be on every other car, and clearly aren't seeing the toads they are running over.

Other than that, yeah there's a few more buildings, especially around the port area, more new apartments everywhere, some new hotels and some more shops here and there (like at Nightcliff).

Some things however, never change. The drivers pretty much exhibiting the same sloth like reflexes at traffic lights for instance. They'll run every red light under the tropical sun but take forever to start when the lights go green.

Then there's the NT News, the local paper. It is unique in Australia and the front page headline was typically a story about an animal (often crocodiles), alchohol and or sex. Extra points for combining all three.

Well here's the front page the first morning I was there:


Which was followed up a couple of days later with this little gem:

The fact that this latter one appeared the morning after the Commonwealth Government handed down probably the most talked about public budget in decades which appeared on every front page in the country, except the NT News. Well, that's if you ignore the "budget" reference to the photo of the python squeezing the life out of a possum!

Anyway, for the record, some power stats and comments from my racing over the last couple of weeks:

National Paracycling TT Championships (LC2):
Hilly course
Duration: 0:38:57
Average Power: 264 watts
Normalised Power: 276 watts
Place: 2nd (~2.5 minutes)

National Paracycling Road Race Championships (LC2):
Very hilly course.
Duration: 2:10:17
Average Power: 225 watts
Normalised Power: 271 watts
60-min mean max NP: 286 watts
30-min mean max NP: 308 watts
Place: 2nd (38 seconds down)

Oceania Paracycling TT Championships (LC2):
Duration: 0:52:27
Average Power: 264 watts
Normalised Power: 269 watts
Place: 1st

Oceania Paracycling Road Race Championships (LC2):
Duration: 1:52:34
Average Power: 216 watts
Normalised Power: 262 watts
Place: 1st

1st 46-min riding with Michael Gallagher (LC1 - categories were combined) before he finally cracked me:
Average Power: 225 watts
Normalised Power: 288 watts

Note: Michael also rode the open elite TT the next day. He won that.

Of all those rides I am most pleased with the National road race. That was a very tough course and I put out personal best power, and very nearly stole a march over my far younger and lighter competitor.

So, 11 months after I first tried to pedal again, and just over two years since my accident and 23 months since my amputation, that's not a bad start for my first season.

Planning for the season ahead has already started. I'm having a couple of easy weeks first though.


Thanks to Ron Bonham for the photos

Read More......

Thursday, May 07, 2009

Another Hour of Power

48.317 km.

That’s how far Jayson Austin was calculated to have ridden on his second and successful attempt to set a new world record for Masters Men (35-39) distance ridden in one hour. It added a huge 2.676km (5.8%) to the previous record set in 2007 by Jason Sprouse of the USA.

Jayson on his way to a new World Record

It is also the second furthest ridden by an Australian, with Brad McGee holding the honour of the furthest distance (not sure exactly how far but it is something over 50km).


It’s also about the same length as this post, so be warned!

I wrote about Jayson’s previous unsuccessful attempt in this post: An Hour of Power, which has been one of the more popular reads on this blog.

So what went right this time? How did Jayson add a whopping 3.649km (8.2%) to his previous attempt where he managed to ride 44.668km?

More excellent photos on the ride taken by Trevor Mullins can be found here:
http://tregan.com.au/photography/Sport/Cycling/One_Hour_Record/

As I have mentioned before, there are three things that primarily contribute to a fast time trial (or in the case of the hour record, to maximise distance ridden):
  • Power to the pedals
  • Piercing the wind (plus fast tyres)
  • Pacing the course
I’ve previously explained these Three Ps in this post: Old Skool.

OK, well let’s consider his first attempt at the record last year.

Power - Feb 2008
Average Power: 241 watts (4.0 W/kg)
Normalised Power: 259 watts (NP:AP = 1.07)

Jayson took quite ill in the weeks leading up to the event and he was clearly not in the form he would have normally expected come race day. In hindsight he probably should have postponed. However that is a difficult choice as the logistics to organise the event make that tricky. In addition, on the day the timing system failed and Jayson had to abandon the attempt after 5-minutes and do a restart. That certainly did not help his cause at all. Jayson also chose to use a gear far too large for his form on the day.

Average Power for his first attempt was 241 watts. Normalised Power was 259 watts, giving a ratio of NP to AP of 1.07. For an hour record attempt, that is a very high ratio and one would expect a very well paced effort on a velodrome would see that ratio being very close to 1.00.

Piercing the wind - Feb 2008
Using the data available from the SRM power meter on Jayson’s bike, I concluded his CdA (a measure of how slippery you are through the air) was in the vicinity of 0.190m^2. That is very slippery for a bike rider by any standard. So Jayson had a pretty slick set up and position. Riding 44.7km with an average power of only 241 watts certainly indicates he was piercing the wind just fine.

Combined with his power, the ratio that most determines the speed a time trial rider will travel at is their sustainable power to aerodynamic drag - FTP : CdA - ratio.

In Feb 2007 that ratio was 241 / 0.190 = 1268 W/m^2

Pacing - Feb 2008
In essence, in the context of his sub-standard form come race day, Jayson simply paced poorly, making the classic mistake of going out too hard and fading. Badly. Ignoring the pacing signals from his coach, this was well and truly demonstrated by the charts in the first linked post, showing how much he faded through the course of the attempt, finally hitting a brick wall at around the 45-min mark.

Breaking his average power down into 15-min sections shows the dramatic fade in power:
00-15 min: 302 watts
15-30 min: 272 watts
30-45 min: 242 watts
45-60 min: 151 watts

I suspect what Jayson did was to ride at a level he felt he would be able sustain but that turned out not to be the case. C'est la vie.

Using my pacing analysis models (something I haven’t written about in any detail here), I have rated Jayson’s pacing with a Pacing Score of 0.960, which is, in fact, the lower anchor point on my relative pacing performance charts (i.e. indicating very poor pacing). A best in class Pacing Score is 0.995 (with 1.000 being theoretically perfect pacing).

To put that into context, if Jayson had ridden with best in class pacing, even with the reduced power at his disposal on that day, he could have added another 1.5-1.6km to his ride distance. He missed the record that day by 974 metres.

These are tough mistakes to make and hard lessons learned. But we often learn more from having the courage to make mistakes. Certainly both Jayson and his coach would have felt a little burned by the attempt (what some may not know is that Jayson had, in training, already beaten the record, just not officially sanctioned with UCI supervision, electronic timing, doping control etc etc that is required for an official record to be set).

In the months following, Jayson’s riding, form and morale slipped somewhat and his coach (a friend of mine), who was moving onto other projects, suggested Jayson speak with me about taking him on and getting him back on track. So Jayson and I discussed where he was at and set ourselves the objective of having another crack at the hour (as well as other racing objectives along the way).

For me, what was going to be important was that Jayson demonstrated a willingness to learn from the mistakes made (both from the ride specifically but also in general). You can be sure that these lessons were not lost on coach, and I consider them to be a substantial contributor to Jayson’s excellent performance the other week.

The biggest failure this time round would not have been missing the record, but in repeating the same mistakes.

OK, so how did the successful ride compare?

Power - Apr 2009
Average Power: 302 watts (5.0 W/kg).
Normalised Power: 303 watts (NP:AP = 1.00)

That’s 61 watts (+25%) more than his previous attempt. Now that’s gotta help. How did he manage it?

This time round Jayson did not get ill before the event. Nevertheless he is still relatively prone to illness, niggles and for some reason, a little accident prone as well (he even had a crash a few weeks before the attempt which did disrupt preparations a little). Jayson also works a full time job, with a lot of manual labour required (he works in the commercial flooring industry). So the ramp up of his training loads were pretty carefully managed to avoid increased susceptibility to illness and at times recognise that his work was sometimes tough on his body and training needed to be cut back. Even so, there were times when Jayson would do more than coach liked, and guess what? – the niggles would appear soon afterwards and training would be compromised.

Over time Jayson really started to appreciate the sense behind carefully managing the training loads. It enabled consistency of training and from that follows a steady and sustainable improvement in form. Jayson told me his form “sort of snuck up on me”.

Of course I did not confine Jayson to just training. Racing was a reasonably regular part of the diet. Every rider needs that little extra motivation at times, and pinning a number on your back is an excellent way to do this. As well, in the final weeks before the attempt, we minimised his exposure to Sydney’s busy roads, with a majority of rides being either with me, a trusted mate, at Centennial Park, on the velodrome or on my purpose built ergobike, Thunderbird 7.

Clearly Jayson has an engine and can really dig out some excellent power at times. What he lacked when we began working together, some 40 weeks before his hour ride, was depth of fitness. Despite very low training loads, he is way too capable of putting the hurt on and suffering the consequences. For those that understand the numbers, his chronic training load (CTL) at the time we started was ~38 TSS/day.

At the time of his hour ride:
CTL: 86 TSS/day
TSB: +10 TSS/day (training stress balance)
CTL/ATL Time Constants: 42/7 days

I did not have Jayson doing huge volumes. What I did do was ensure Jayson was doing quality work. Good solid endurance. Plenty of sweet spot / tempo work. Threshold tolerance work. And during the specific race preparation period, high end aerobic power work and specific threshold work on the track bike and in aero position at the track. The limited taper involved cutting back volume while using short but relatively intense intervals at the higher end of his aerobic power level abilities.

Here is a comparison of his power last time and this time:


Piercing the wind - Apr 2009
OK, so I have already established that Jayson was pretty darn slick through the air. But was any further improvement possible? Well yes as a matter of fact. Some positional changes, a different set of aero bars (based on a British Cycling design) and use of double disk wheels resulted in Jayson’s CdA lowering to around 0.185m^2. That’s a 2.6% improvement. It doesn’t sound a lot but that is worth approximately another 420 metres to his ride.

The bike exactly as ridden.
Thoroughly checked to ensure full compliance with all UCI regulations.
Note placement of the SRM PCV under the saddle.
Of note was that on this attempt, Jayson rode with a standard "under ball of foot" cleat position. In Feb 2008, Jayson used a mid-foot/arch cleat position. The fact that improved aerodynamics was achieveable despite the higher saddle position required of the regular cleat position would not be lost on some astute readers. Jayson also received a lot of support from fit guru Steve Hogg, mainly addressing many of the regular niggles, minor adjustments, use of various stem options, different saddles etc.

During training at the track, where possible, changes in position or equipment were compared to assess the differences. An alternative aero helmet was tried for instance and found to be substantially less aerodynamic than the Uvex that Jayson used. This is one of the direct and practical benefits of using power meters. It removes much of the guess work and objective decisions can be made based on the data.

So now Jason's FTP:CdA ratio is 302 / 0.185 = 1632 W/m^2

Even so, I would say that further improvement with his aerodynamics is still possible. There are still several minor details which, with enough solo track time, I would like to have tried and tested but they will just have to wait for another day.

Pacing - Apr 2009
Well I’m glad to report that Jayson now has the unique honour of topping the pacing league table, with a Pacing Score of 0.998, the best score I have ever recorded, as well as being the low anchor point (0.960).

Let’s just say that of the things that were drummed into Jayson’s head, pacing was what I was most concerned with. I knew he had the power. I knew he was slick. But would he be able to execute?

To ensure that happened, we did a lot of work in the weeks leading up to the attempt focussed on pacing. I developed a means to clearly communicate pacing information to him and Jayson began to develop an excellent “feel” for how to augment his effort ever so slightly each lap to maintain a sustainable pacing level. His choice of gearing was part of that strategy.
One thing went against the “conventional wisdom” – Jayson’s average cadence was 112 rpm. Conventional wisdom says Hour Records are all but set with a cadence of ~100rpm give or take 1 or 2 rpm. Bollocks to conventional wisdom I say.

Pacing information, lap times etc were conveyed on a regular basis

We also knew that different environmental conditions would impact on the sustainable pace on the day and we trained on different days with subtly different conditions. On the day of the attempt I checked both the air temperature and air pressure and that would tell me what pacing would likely be sustainable (and what wouldn’t). Dunc Gray Velodrome is not climate controlled and the temperature can and does vary quite a lot.

For example, a 5C drop in temperature would reduce the distance ridden by ~ 280 metres and an increase in air pressure of 20hPa would mean another 315 metres lost. Fortunately it was not a cold (21C) nor a high pressure (1004hPa) day although it had been warmer in training. Also, we requested that all windows and louvres be closed so as to minimise any potential wind disrutption and to retain as much heat inside as possible (April is Autumn in Sydney).

Of course the athlete is the one that must make a call on how hard to go but I had developed a very good understanding of his body language and could tell when it was too hard. Jayson was never going to go too easy, that’s for sure. My main concern was keeping a lid on it in the opening minutes. Jayson was made well aware of the lap times and how that played out relative to the existing record. The pacing mistakes were made in training, and ironed out in training.

On race day, nerves and adrenaline took a hold (I expected it, heck coach was nervous too!) and Jayson’s pacing was a little up and down in the opening minutes. However he made rapid adjustments knowing full well what over cooking it would do. It took quite a while but once he settled into a rhythm, his pacing was metronomic. Average lap times around the 250 metre track were 18.59 seconds (not counting the opening lap).

We had planned for a couple of “rest” breaks, where he could sit up, stretch, relieve any pressure points for a lap or so but as it turns out he didn’t need that and remained firmly in position for the entire hour. At times he varied his pace a little, and sometimes pushed himself back in the saddle, which was quite deliberate and helped him to stay comfortable and keep his concentration going.

Here is a comparison of his speed last time and this time:


That's more like it!

Thank you to:
Apart from Jays actually having the gumption to have another crack and delivering, there were many others involved in helping him get there and all should rightly share the success, including his former coach (hi Peter) who introduced him to training with power in the first place and showed what was possible, sponsors, the officials who helped coordinate the venue/UCI/ASADA etc, our club chief Mike, Jayson's family/support crew, Steve Hogg who was very accommodating with equipment and constant positional adjustments, training and racing buddies who kindly lent special gear (wheels, bars) for the attempt and rode/raced with Jays during the build up. And then all those that showed up to cheer him on!

Footnote:
Just six days after his record breaking ride, Jayson was knocked from his bike by a car while on a ride by a “hit and run” driver. Knocked unconscious and very, very nearly run over by another oncoming car, who’s driver managed to stop with the bumper bar over Jayson’s head, he is lucky to be alive. Jayson was admitted to Manly hospital and fortunately suffered no broken bones. However he did suffer from a sizeable haematoma and severe swelling of the thigh which required emergency surgery to open the leg (a fasciotomy) so that excess fluids could be drained and the swelling would not prevent blood flow. That was successful but now he has a large open wound which will take some weeks to heal.

He has since been discharged and it will be at least eight weeks before he can work or ride. As you can imagine Jayson is pretty pissed off about the incident but otherwise is in good spirits.

So now it will be onto the next challenge, getting an injured soul back to good form. That's something I have some experience with.

Well done Jayson! A super ride.

Photos: David Lane, Action Snaps:
http://www.actionsnaps.com.au/

Read More......

Saturday, May 02, 2009

Brutal but good

Just back from a brutal road race - the National Paracycling championships being held in Murwillumbah - over same course as used for the Junior U19 men and women earlier in the day.

I am now officially tired and sore. 2nd again (4th overall in combined category race). Hard to combat those skinny kids! But I was close. They got away on the biggest climb on 1st lap of 4 (with 4 climbs each lap the last one is ~1.5km at 7-10%). Knowing there wasn't much point burying myself just to get dropped by them again, I sat up and waited for the leading tandem pair in the blind category who were only 50 m behind me and they towed me round the next three laps. It was hard enough hanging onto the tandem!

We were making ground and on the last lap (in the rain) and had them in sight, and on the penultimate climb, I said "thanks" and decided to make my move. I got to within 30m of them at the base of the final climb but couldn't quite bridge and had to watch them ride away bit by bit, so I probably finished maybe a minute down. Shame, I reckon I'd have done them in the sprint. This is same guy who won the TT by over 2.5 min, so I had a good ride but I sure needed that tandem!

Still, I was giving away 20 years and 20kg on these guys, so all up I'm pretty pleased with that effort.

2 x Silver medals at Nationals is good going less with than a year back on the bike. :D

Read More......

Friday, May 01, 2009

Silver Bullet

Well, not exactly bullet like!

Para-cycling road nationals on at the moment. TT was yesterday and road race tomorrow.

TT was good, I came second in my category (LC2) which given the hilly course I was pretty pleased with. About 2-min down on winner though, so some time to make up.

Other news of course was Jayson Austin's record breaking hour ride on the weekend, setting a new mark of 48.317km. I'll have more to write up on that in coming week(s).

That's all for now folks!

Cheerio

Read More......

Saturday, April 11, 2009

bon anniversaire II

April 11. Two years to the day since my accident.

How time flies when you’re having fun.

Year 1 was about hospital, doctors, nurses, surgeries (seven of them I think plus multiple minor procedures), drugs (and associated hallucinations), pain, basic recovery, the physical and mental highs and lows, never really knowing how long it would take to get better and just coping with crap. It was also a year of unbelievable support from family, friends and work colleagues.

Year 2 was about getting some normality back to my life (you know, silly things like being able to walk, being able to walk without pain, getting back to doing some work). Naturally, a large part of normality for me was starting to ride the bike again, which I’ve been doing bit by bit since mid-June 2008 when I first turned a crank over on the indoor trainer. And regaining some semblance of fitness as well as losing some weight. Again the support of so many good people shone through and that is good to think of when you have a less than good day.

So what does Year 3 have in store?

Well I have a few ideas, but mostly it’s about evolution and continuing to rebuild this body.

Today I celebrated by doing a quality endurance ride out to Kurnell with a buddy and one of my coaching clients, Jayson Austin. I’ll be writing about Jayson more later – he is attempting to set a new world record for the Masters age group hour record. That happens a couple of weeks from now. Our ride was good. 80km, and for me a workout intensity (IF) of 0.84 (for the main section of ride) and 175 TSS. 12 months ago I could barely walk.

Coming up are a few exciting things:

At the end of April I travel to Murwillumbah in northern NSW to race the National Paracycling Championships. There is a Time Trial and a Road Race. It will be my first attempt at a paracycling event, so there is much to learn in terms of how it all operates. I suppose it’s just another bike race. Done plenty of those!

Then two weeks after that I hop on a plane and travel to Darwin at the top end of Australia for the Oceania Paracycling Championships, which are being held in conjunction with the Arafura Games. Again that involves a Time Trial and a Road Race. It will be interesting to see Darwin again. I lived there for two years in the mid-1990s.

At some stage over the next four weeks I expect to receive a new leg. Well two new legs actually. My current one no longer fits as well as it should and so it’s time for a new one. So it will be bye bye to Schooner II and in with the new. I was thinking, in Cervelo bike naming convention, perhaps I should call this new leg the PC III.

I went in to see George at the ALC to be fitted just over a week ago. So I will get a new general purpose leg. But the best bit is I will also be getting a dedicated cycling leg. That will be uber cool! No more screwing on/off a leg attachment. Yay! The funds raised at my benefit night last November are really helping to make this all possible.

I am also in the process of putting together a time trial bike and am at the bits gathering stage.

Beyond that, I have a few things marked in the calendar but I have my eyes set on getting to the 2010 National Paracycling Track Championships and being in excellent shape and form. Who knows, maybe I’ll even have a crack at the paracycling hour record.

In terms of general progress, well the last update was summarised in this post.

That chronology went up to 25 September 2008, when I performed a Maximal Aerobic Power test at which I attained a MAP of 355 watts. So summarising since then:

28 November 2008: My benefit night and photos.

16 December 2008: 16km TT test – 287 watts
19 December 2008: MAP Test – 385 watts
Both written up as part of my Swiss Watch post.

26 January 2009: Australian Day Race

14 February 2009: Coaching the Bicisport Team Pursuit squad

1 March 2009: First Road TT at Calga

13-15 March 2009: State Masters Track Championships

5 April 2009: Calga TT Part II

Here’s my Performance Manager Chart since I began turning a crank 10 months ago. Click this link for an explanation of what it means (basically the dark blue line going up means I am training more and gaining fitness, and when it goes down I'm training less - not necessarily losing fitness, as that depends for how long the line keeps dropping). Click on the picture to see a larger version.


It shows how my training has steadily ramped up but I have had a few unscheduled interruptions. Early on I had some trouble with my leg not coping so well and needing a week and a half break. After that coach & I were able to continue to ramp up my training for six months, with just one interruption when some unexpected family business required my attention.

Then another problem with my leg happened just as I was approaching a Chronic Training Load (CTL) of 70 TSS/day. It’s frustrating but having had a similar experience already, I knew that it just needed some time to recover. This time it didn’t take as long and I was back on the bike leading into the track championships, which went quite well. However I picked up a cold/flu bug while competing and that knocked me off the horse for a week afterwards. I have since been working my way back from that.

Every day I get on the bike, it’s something new. You learn to adapt. I doubt that need will change from here on.

Bring on Year 3.

Read More......

Sunday, April 05, 2009

New Skool

OK, a follow up to this earlier post ("Old Skool") about a local time trial (TT) I raced last month on my normal road bike.

On that ride I completed the not quite 25km undulating Calga TT course in 42:55.

I also referred to the importance of the 3 P's of riding fast TTs (well as fast as one can go):

1. Power to the pedals
2. Piercing the wind
3. Pacing the course

With power meter data, the environmental conditions known and some special mathematical wizardry, I am able to quantify each of those three Ps from my ride last month:

1. Power:
My power average was 264 watts (normalised power 268 watts).

2. Piercing the wind:
I estimated a Coefficient of Drag x Frontal Area (CdA) of 0.334 m^2. The lower the CdA, the faster you go for the same power output.

3. Pacing
My Pacing Optimisation Score was 0.990, which ranks between "excellent" and "best in class" and means that in order to attain "best in class" level of pacing, there was another ~ 13 seconds of time savings to be found on course. Those savings can be found by dosing your effort carefully on the course depending on the terrain.

Of these 3 P's, the biggest gains (in a month) were going to come from improving #2: Piercing the Wind.

My pacing is already pretty good (but always room for improvement).

As for power, well that was a bit of an unknown for a couple of reasons, one of which I'll get to in a moment. The other reason was I recently had a bad head cold and needed a full week off training. That's never a good thing when you are training well to improve your power. If you have a good amount of training behind you, it often doesn't hurt your power much, provided you allow yourself to recover properly and don't start riding hard too soon and end up prolonging the illness.

So what about piercing the wind?

After my Old Skool post, a generous offer was made by a former coaching client of mine to loan me a TT specific bike (for a while until I can sort out my own rig). That was an offer too good to refuse, so last week the bike arrived and yesterday was my first and only chance to work on getting the set up right. It even has a Powertap power meter so that was a big bonus :D.

So it was off to Centennial Park for some time riding and making adjustments to the saddle position, the bars, arm rests and so on until I felt I could ride the bike OK. Main challenge was being able to pedal without the prosthetic hitting my arm on the upstroke. It's really annoying. I got it to a stage where it was hitting slightly but not enough to ruin a ride. I will have a solution for that, which I'll write about in another post (some news coming about my new legs).

Sometimes when you go from a road bike position to a TT bike position you can lose some power as you are not used to the different joint angles and so on. Typically you are looking to maximise your aerodynamic gains without much sacrifice in ability to produce power (in the end it's maximising speed that matters). That can take quite some time to optimise as you need time to adapt to the new bike position. I didn't have that luxury as the TT was today.

Here's the loaner bike:


Bike has an aero bar set up and 38mm deep carbon rims, so not a complete aero set up (which would have a rear disk wheel and a deep section front wheel). Also, I am not as yet using an aero helmet - I used the same standard road helmet as last time as well as a skin suit.


So what happened this time?

Conditions today were very similar to last time: calm to very little wind with the same air density at 1.179 kg/m^3 (different temperature, barometric air pressure and humidity between each day but all the variations cancelled each other out to end up with air that was the same density). In other words, the two TTs can be readily compared.

My race time was 41:14, which is 1 minute 41 seconds faster than last month.

So how did the 3 P's compare to last time? Here are the numbers (with previous month's TT numbers in brackets). They allow us to assess how much each component of the Three Ps contributed to my extra speed.

1. Power:
Average: 263 watts (264 watts) - basically the same power
Normalised: 269 watts (268 watts)

2. Piercing the wind:
CdA: 0.286 m^2 (0.334 m^2) - a 14% improvement

3. Pacing the course:
Pacing Score 0.991 (0.990)
Time lost compared to Best in Class pacing: 8 seconds (13 seconds) - so a 5 second improvement through better pacing


So it's pretty clear that the vast bulk of speed improvement was due to my improved aerodynamics, all achieved simply because I was using a bike that enabled me to ride in a much more aerodynamic position. Now if you ever wondered why some riders obsess over aerodynamics - well there's your answer!

Just to put the aerodynamic changes into perspective,
that's over 4 seconds per kilometre faster for the same power.

The nice thing about this is that there are more aerodynamic improvements to be made, and one would hope that my fitness will improve and that I'll have more power available once I adapt to the TT position. As for pacing, well I seem to have that pretty well sorted.

One final comment on the day. Last time I experienced some problems with my leg fitting becoming loose and painful in the latter stages of the TT. I didn't experience the same problem today. I packed extra foam into my leg this time and conditions were a little cooler which more than likely meant less sweat build up inside the leg liner. It still works loose gradually over time but it was much better today and no significant pain.

My next TT will be at the end of April, when I tackle the challenging Mooball TT course in northern NSW. That is part of the 2009 National Paracycling Road Race Championships. Should be a hoot (although I wish it were a flatter course).

Read More......

Wednesday, March 25, 2009

Matchfinder

No, this isn’t a chat about online dating websites! It’s about a method to quickly identify when, during a race, you “burnt a match”.

The concept of a “burning a match” isn’t a new one in cycling – basically it’s a metaphor for saying you did a hard effort, hard enough that it might impact on your ability to do other hard efforts later on in the race, since a match can only be used once. While not a perfect analogy, it’s not a bad one.

How many matches we can burn and how brightly and for how long those matches can shine for might be thought of as the size and quality of our personal matchbook. It’s one measure of our race specific fitness.

Performing well is as much about knowing when to "light one of your matches" as it is about doing the training to build up the size and quality of your matches and the number of matches in your matchbook.

Burning a match is also relative to the race in question. In a 3-week Grand Tour, a match might be akin to a long solo/small group break away or an attack on an alpine ascent, but in a 20 or 30-km points race on the track, it would be an attempt to gain a lap, or go for lots of sprints.

Typically, burned matches are attempts at race winning moves
or, for some, race survival moves.
In any case, often riders like to analyse their power meter files to see when, how many and how big were the matches they set off while racing. It's one way to help assess, post-hoc, the tactical decisions taken while racing (did you really burn an unnecessary match going on a fruitless escapade?) or simply as a way to assess how many and how often matches were lit before you cracked, or even an indication that your matchbook is getting bigger with training.

In the book, Training and Racing with a Power Meter, it shows one way to locate such efforts by using the fast find feature in the WKO+ software. I’m going to show another method, one, that with just a little bit of spreadsheet help, is pretty easy to do and which shows up matches quite clearly.

Again, as with much of what I write, it’s not an original thought. It is based on the Normalised Power concept developed by Andy Coggan and just such a chart can be seen on Slide 15 of his PowerPoint presentation hosted on Google docs:
“Making sense out of apparent chaos: analyzing data from on bike power meters”


OK, so let’s look at an example of what I’m talking about.

Let's take my points race at the recent State Masters track championships. Here’s what the power meter trace looks like for the race:


It shows my power output for the race, as well as horizontal lines showing my Functional Threshold Power (FTP) and my Maximal Aerobic Power (MAP). As is typical with these sorts of races, the power output is highly variable and while you can see some spikes, it is difficult to make all that much sense out of the information presented like this.

But with a little bit of maths applied to the power data, here is a plot of exactly the same race:


Now this really shows up where I burned my matches. In this instance it clearly shows the 6 sprints in which I either contested (the first and the last) or simply needed to put the power down to stay in the race (the other 4). It also shows the periods where I didn’t sprint at all (sprints are every 10 laps in these races about every 2.5 - 3 minutes depending on the race speed), which is when I was in a chasing group as laps were being taken/lost by various riders.

By showing the data in this way, it is really clear when matches were lit. My first one was a pretty big flare, as not only was there a strong sprint but it was clearly an extended effort, perhaps covering an attempted attack after the sprint. But it also shows that after a couple of sprints, I simply didn’t respond when the inevitable attack came. I needed another match but my book was getting a bit thin at that stage.

Here are a couple of other similar plots:

This one is from the State Masters Criterium Championships in 2006:


As is evident from this plot, the first 10-minutes were pretty brutal with some very hard efforts necessary. In this period the field was whittled down to a break of just 6 riders. Then the break settled somewhat, before some more attacks started in an effort to ‘break the break”. It is also clear that on this course, if you couldn’t repeatedly make such hard efforts, you would be toast, limping back to the hotel for an early shower. It was a "repeatedly go hard and recover" kind of course.

Here’s another example from a different type of crit race:


This time I made a solo break very early, then was joined by another rider after about 15-minutes or so and we stayed together up to the finish. You can see the large match early on, and then the smaller efforts while solo, which diminished somewhat when I was joined by my break companion and we established and consolidated our lead. This enabled me to save a big match for when it really counted - the final sprint.

So how are the above plots made?

Well it’s not hard and if you know about Normalised Power, then you’re well on your way.

1. Just take a normal power meter file and open it in Excel (or your preferred spreadsheet software).
2. Then calculate a rolling 30-second average of the second by second power data.
3. Then raise that rolling 30-second power value to the 4th power (watts^4).
4. Then chart that 30-second power raised to the 4th power by time.

That’s it.

I also added lines to show both FTP and MAP raised to the 4th power.

Hint: The chart is a x-y scatter plot, with horizontal (x) values being time and corresponding vertical axis (y) values the power^4 values.


Why 30-second averaging and why raise to the 4th power?

Well, in essence the 30-second averaging and the raising to the 4th power is because (and I quote from Andy's own item on Normalised Power):

  1. the physiological responses to rapid changes in exercise intensity are not instantaneous, but follow a predictable time course, and
  2. many critical physiological responses (e.g., glycogen utilization, lactate production, stress hormone levels) are curvilinearly, rather than linearly, related to exercise intensity

As for #1, as Andy has shown us in the Google docs presentation referenced above, the half lives of many physiological responses to the intensity we are riding at (i.e. our power output) are indeed not instantaneous. The time period for such responses to show up is typically around 30-seconds or so. Some, and I quote, include: PCr kinetics, heart rate/cardiac output and sweating all having half life response times of around 25 seconds. VO2 ~ 30-seconds, VCO2 ~ 45 seconds, ventilation ~ 50-seconds and core temperature changes ~ 70-seconds.

So from the point of view of assessing our body’s responses to intensity (power output), it makes sense to view power meter data as a rolling average power over a 30-second window*. It doesn’t actually have to be 30-seconds but changing the duration of rolling average (to say 25-seconds or to 40-seconds) doesn’t have a large impact on the outcome of the plots.

* except perhaps when assessing maximal neuromuscular sprint type efforts, since the energy systems in use fatigue over a handful of seconds (although our "recoverability" for sprints is still linked to our aerobic or "matchbook" fitness).

This is also why we sometimes refer to things like heart rate as being a "lag indicator" of effort and is one reason why HR is a poor guide to managing shorter harder efforts while training.

As for the #2, the research Andy shows suggests an exponential relationship exists between blood lactate concentration and power expressed as a ratio of 1-hour power (power:FTP, often referred to as the Intensity Factor). In the same presentation one can see (on slide 13) that the best fit for the data shows a relationship very close to the 4th power (3.91).

Again, the use of a nice even number of 4 rather than say 3.9 is simply more convenient and choosing numbers either side really doesn’t affect the nature of the plot all that much.


So if you cracked in a race, or couldn't go with the winning break, then what does your match analysis look like? Did you not have a match when it counted, or did you not use them wisely enough?

Just remember, playing with matches is dangerous, so take care out there!

Read More......

Friday, March 20, 2009

Championship Comeback


This past weekend, I participated in the NSW State Masters Track Cycling Championships. I say participate as I was not really likely to pose a threat to the podium in any of the three events I entered.

On Friday night was the Time Trial, which for my category is a 750 metre (3-lap) blast around the Dunc Gray Velodrome. Pretty simpe event really. Once the starting gate releases your bike, you go as hard as you can until you complete the 3 laps.

I was hoping to break 62-seconds.

Just before my final warm up I went to put on my leg but something was wrong, the cleat was twisted out of place.

Thinking it was just the lower clamp bolt that for some reason was loose, I got on the bike to get the cleat angle right and have a buddy tighten the clamp for me.

Except it didn't look too good to tighten.

That's when we discovered a stress crack/fracture in the lower clamp on my prosthetic bike leg attachment which meant the lower clamp-cleat section was completely loose (you could pull it off the end of the pylon). Wasn't there day before.... I know, I gave it a good look over and clean.


Managed to carefully tighten the bolt enough so the section wouldn't move with hand pressure at the same time as to not widen the crack anymore. But I gotta say, it was at risk of major fail in the TT. Bugger it I thought. You came here to ride. If you crash, so what? I've had worse.

But it didn't fail, although I was probably a little tentative out of the gates.

I ended up going better than a 62 with a 60.646 second ride. I figure if Chris Hoy has to do 4 laps to my 3, I'm in with a shot!!

The track time trial is not my natural event but the post-accident Alex is rediscovering all things bike, and so I'm going back to riding a range of events rather than necessarily specialise at this time.

Besides, this year is all about re-building a broken body.

Fortunately, I was able to find a spare clamp on an old "foot" I had in the cupboard, so that went on the leg and all is good again. Who'd have thought you'd need spares for your leg! LOL.


Next up was the 20km Points Race on Saturday afternoon. Now this is my natural event but nowdays I have an unnatural body. So what would happen? I stuck on a pretty tall gear (for me) - a 96.4" (50x14) as I was pretty sure I would need it.

Small field of 13. Still some class riders with world and national masters champs amongst them. Mission: well just get out there and race, and what will be will be.

So with that in mind we rolled out, and before long the first of 8 sprints (which are every 10-laps of the 80-lap race) was on in earnest. Hang on, what am I doing at the pointy end? Hmmm, OK well you're in the slot, so roll with it. 2 points - hey the race has only just started and you're on the board already!

Then it started to get interesting and most of it between laps 10 and 70 is a bit of a blur. But one by one the laps ticked off and I was still there. More than half didn't finish, being spat out the back. I did end up losing a lap (and 20 points with it) along with a small group when the bunch was split. In the end, only 6 riders finished and I was thereby placed 6th, equal on points with Tony from Canberra. Somehow I even managed to help out a couple of team mates along the way. That was fun. Hard but fun.

So after that lot, I had to back up for the 3km Individual Pursuit on Sunday morning. Of course I had crunched the numbers and set myself a, for the time being, challenge of going 4:06 for the 3,000 metre event.


I did a 4:10 but that's all I had in the tank. I would liked to have ridden faster but legs doth protesteth and I knew I had to just run what I brung.

But then again, it was a 4-min power PB so one can't be too harsh on oneself.

It was good to be back.

(and before all you power meter freaks out there are worried about me not posting any data - fret not - I'll have some more techno geekery analysis to share in the next installment).

Read More......

Sunday, March 08, 2009

Old Skool

Time trialling is a popular part of the sport of cycle racing. The "race of truth" is deceptively simple. Ride a set course by yourself and try to finish it in the shortest time possible. Fastest time wins. Easy.

As always with this sport, there are a number of elements that go into riding the fastest time you can. But in essence, they come down to the three P's:

1. Power to the pedals
2. Piercing the wind
3. Pacing the course

If you don't address all three "P's", you are riding sub-optimally from a "least time" perspective.

Power is all about the training you do to improve your fitness and your ability to ride harder. The power and training part of the equation is something I've written lots about on this blog.

Piercing the wind is all about the aerodynamics of your bike and especially your position on the bike. Given this is about the physical elements that resist our forward motion, I also include a few other items, like having the best tyres for the lowest rolling resistance and an efficient drivetrain so power is not "lost" between the cranks and the rear wheel.

Pacing is the skill part of the equation and is all about knowing how hard to push yourself at various times on the course. Pacing is something I've also written quite a bit about (but not here on my blog), and for which I have developed some mathematical modelling. I'll write a bit here about that one day.


Anyway, what's all this fancy pants maths got to do with "Old Skool"?

Well last weekend I rode a TT. It's our "local" TT run by the NSW branch of the Australian Time Trials Associations (ATTA) which is held on the first Sunday each month on the Calga course, about an hour's drive north of Sydney.

I decided to get back to doing some TTs for a few reasons. Firstly, since they are a race against the clock, once you have set a time then you have a benchmark for improvements. In essence you are racing only against yourself. They are an excellent fitness marker, especially when you are measuring your power output.

Secondly, I have also decided to race the paracycling national road championships (late April-early May), which includes a road TT (and a road race). So getting some similar length TTs under my belt seems like a good idea.

Finally, as I keep on with my return to the bike, I need to rediscover the type of competitive outlets that will better suit my new "body". So going back to riding many different types of events is one way to re-learn all about that.

Anyone who's ridden a TT, or even just watched one, will know that many riders use special bikes which are designed to improve the aerodynamics of the rider and bicycle. Much thought goes into this as it can result in big savings in time for the same physical effort.

However, some riders decide to ride TTs "Old Skool" style, meaning they use a standard road bike with standard wheels and helmet. No special effort is made to improve aerodynamics. That's what I did last week.

For some fun, below is the graphical summary of my ride and pacing analysis.


There's a bunch of stuff on there I won't go into today but in essence it shows the course elevation profile (it's an out and back course, with the first half mostly climbing) with elevation data obtained via two methods I won't describe here now, and two lines showing power - the yellow line is my actual power output (a 40-second rolling average) and the green line is a theoretical optimal power output for that segment of the course. By comparing the two lines you can see how well or otherwise I dosed out my effort along the way. So thats the Power and the Pacing elements.

There are also a range of other numbers shown, one of which is an estimate of my Coefficient of Aerodynamic Drag and Effective Frontal Area (CdA), which is a measure of how well (or not) I slice through the wind. Thats the "Piercing the wind" element.


OK, so how did I go?

Time: 42:55 @ 35km/h.
Average Power: 264 watts
Normalised Power: 268 watts

Not too bad given it was on standard road bike, helmet and wheels and the constantly up 'n' down Calga course. That placed me 25th out of 45 riders.

I was hoping for more like 270-280W (my first 20-min were at an average of 277W and holding myself in check) but I struggled with my prosthetic leg getting loose after about 15-20 minutes which saw 2nd half power fall somewhat and quite a bit of stump pain in the latter stages. My stump was very sore afterwards.

But that was exactly the point of the exercise - to find out the issues I face and need to fix when doing this sort of an effort. On a course like Calga, which is never flat and the power is somewhat more variable as a result, then the leg does tend to work loose a bit more quickly than say on a flatter road or on the ergobike where the effort is far steadier.

Main thing is to work on a solution for keeping my leg packed firmly in the socket during a longer hard effort. Otherwise it hurts and more importantly, you lose power. Maybe I needed to use more foam packing (which is what I'm doing at the moment). I probably didn't put enough in. Then there is the socket itself, which my rehab doc and prosthetics specialist says no longer fits properly (I have lost weight and my stump has changed its shape and volume again).

Of course I am also getting a special cycling leg made up, thanks to the generous donations and fund raising by the track cycling community here in Sydney. That is now being planned. I have the appointment to recast my stump on 2nd of April and from there we can begin the production of a new leg socket and a new general purpose leg. I can hardly wait!

So at the Calga TT next month I may be able to borrow a TT bike and see what difference it can make to my time. The analysis above shows a CdA of 0.33m^2 (square metres), which is very high for anyone doing a TT. Certainly riding on a TT bike I would expect that number to be much lower. Even at a modest 0.28m^2 (certainly readily attainable on a TT set up) I could expect to ride that same course in the same conditions (wind, temperature & air pressure) at the same power about 2-minutes faster.

We'll see.

Read More......

Friday, February 27, 2009

Team Pursuit Championships

Bicisport Team Pursuit Medallists.

14 February 2009.
22 riders.
6 teams.
3 race categories (Masters all ages, Masters 150+, Elite Women) .
1 Manager.
1 Coach (me).

2 months of weekly team preparation rides (with a break over Christmas / New Year).

When you have 22 riders all wanting to ride in Team #1, it makes for a challenging task to sort out the right combinations.

We had seasoned team pursuiters, some that had barely ridden the track before, strong riders that didn't have the pedigree in team pursuiting, seasoned team pursuit riders with form that needed to pick up, sprint oriented riders, roadies, track enduros, riders from several geographies. We had it all.

Then, once you settle on the combinations, you then need to work on the contingencies. Who are the subs to go up if a rider drops out for some reason? What is the best order of riders in a team? Where are the weaknesses and how can you minimise their impact? All good fun.

Somehow we pulled it all together and at the end of the day:

35 teams entered Championships.
6 Bicisport teams rode.
5 qualified for finals.
4 medalled.
2 Silver.
2 Gold.

2 x Championship record times set in men's qualifying and one again set in final.
Inaugral Women's event (qualified both teams for Gold final)

Bicisport now holds the State record time in both Men's masters categories and Women's elite team pursuits. For a club of ~ 75 riders, I reckon that's pretty impressive.

Cracking rides by all teams. Not a foot wrong all day. While I shouldn't pick favourites, the one that stood out for me was not the record setting rides but Team 2's qualifying ride, which saw them post 4th fastest time and qualify for the bronze ride off. Getting 2 teams into the finals in an ultra competitive category was really a highlight. They missed out in the final, getting nailed by a strong Sutherland outfit. Not to say the other rides weren't worthy, they were all tremendous.

Congrats to the Tuggeranong express train that took out the all ages final by 0.3 seconds. It was a cracker of a race and went down to the wire.

Nice work team!

Special thanks to Stuart Lane for being there at training every week to fill in the gaps as needed.

Coach exhausted.
Coach wants to ride it next year instead.

Read More......

Saturday, February 21, 2009

HOP to it!

Quite a few years ago (circa 2002), I learned of an indoor workout called "The Hour of Power" or HOP for short. It was coined by Bill Black, a regular contributor to the Google Wattage Groups forum. The workout also features in the book, Training and Racing with a Power Meter.

It's a pretty simple style of workout, designed to lift your power at threshold as well as provide a bit of a neuromuscular twist. Indeed any solid tempo effort at this level is very good for helping to lift one's threshold power. They are not easy workouts and can be quite fatiguing, so it does help to build up to doing them if you haven't been riding much lately.

There have a been a few different formats but the basic theme is the same:

Ride at a base load that is sub-threshold (~90% of your 1-hr maximal power) and every few minutes do a surge for about 15-seconds or so. Doing this mixes up the workout and does help to make the time pass a little more quickly.

Since today I was planning on a 90-minute solid tempo ride, and it was raining outside, I decided to do my workout indoors on Thunderbird 7 and thought, you know I've never actually had a go at the HOP. So that was today's mission.

Actually I ended up doing what you might call HOP+, since I did want to do 90-min of tempo, rather than the hour. So I decided to do a HOP, then assuming all was well would finish off the workout with some more tempo. This is what eventuated:


This is the picture of the workout data (click on it to see a larger version). The two horizontal dashed lines mark my Funtional Threshold Power (FTP) and 90% of my FTP. Plotted are my power output (yellow) and cadence (green). The boxes show the stats for the HOP and for the tempo effort that followed.

After I finished the HOP, I "hopped" off T7 to do the usual remove leg and liner, dry down and replace before getting back on for the final 30-min of tempo riding.

An interesting personal observation was as the workout progressed, I seemed to get better. The tempo at the end was taxing but not a killer by any measure. No doubt it won't be like that everytime I do it.

All up, a really good quality session. You should give a go one day.

Read More......

Tuesday, February 03, 2009

Surface Area

I haven't posted about my own training bits 'n' pieces lately. So a brief update.

All is going well. My training is now a regular 5 days/week routine, sometimes a 6th day recovery spin if I feel like it/have the time. Riding consists of a longer ride on Sundays, a solid tempo effort on Saturdays (now doing 1.5hrs of tempo ~ 85-90% of FTP), specific threshold development intervals midweek (your typical 2 x 20-min intervals at near TT effort ~ 95+% of FTP) and core endurance level riding otherwise, with the occasional race thrown in for a bit of fun.

The long rides have been ~ 2.5hrs so far and most other rides are typically about 1.5hrs. An interval session on Thunderbird 7 might be a little shorter.

Here's the latest chart showing how the training loads have been growing at a steady rate.


In terms of power output, well I can't say I've noticed great leaps in performance over the past month or so but that's not unusual as the training loads have been progressively increasing and so the legs are mildly fatigued. Also fitness gains can kind of creep up on you. The only problems I've had have been with some exceptionally hot days, when I struggled to hit desired training levels, so on those few days you just accept it won't happen and move on. Indeed, there have been days I trained indoors because it was too hot outside!

Certainly this morning I did my 2x20s OK, with the first completed at an average of 262 watts and the next one I let it rip a bit more, ending with an average of 274 watts (which was 264W 1st half and 284W 2nd half). My current FTP is estimated at 275W.


Australia Day Race

On Australia day I raced the, er, Australia Day Race, one I've raced several times before and reported on a couple of years back in this post. Apart from being the usual blast around Heffron Park, it's also a fund raiser for the Children's cancer foundation.

This year the race format was different - a handicap criterium with 3 grades. Not entirely sure where to ride, I just put myself in the limit bunch and figured I'd see how it would go.

Before the race I rode to Heffron Park and did a couple of laps of the circuit. Mind you I've been around it a gazillion times, so it was more a sense of assessing how the wind is as that helps me make some tactical choices about what to do at which points of the circuit.

Anyway, I might have been better in middle chase bunch as limit wasn't very hard and most of them couldn't corner all that well or go that hard to drive a break so I just rode like a good warm up waiting for the catch to happen. When we were caught by the chasing bunch, I immediately inserted myself into the faster group and then just maintained position working my way to front 5-6 riders with a lap to go. But rather than continue the drive and good speed, the front 4-5 riders shut it off (what were you thinking guys?!) - and of course that was enough for the scratch bunch to bridge the gap.

Cruising with the limit bunch. Still a few kgs to lose!!


So with 1km to go I ended up on the front of a 50 rider bunch keeping a good tempo and looking for an attacker (there's always someone who can't help themselves). Right on cue John Sunde came through hard on my left and I instantly got his wheel, and we had a gap with 500m to go but he shut down once we hit the main finishing straight(!) which meant I had the bunch back on my tail and was staring down at a 350m sprint into the headwind LOL. I lasted maybe 3 seconds before I was swamped. All good fun. But what's the deal letting a bloke with a bit of leg missing lead the bunch inside the last km? Gotta laugh.


Riding with a Prosthetic

One of the experiences when riding with a prosthetic leg is the way the liner, which goes over my stump and connects me to my prosthetic's socket, gradually fills with fluid (sweat) and begins to loosen over time as you ride. Every day is different as to how long it takes before I need to stop, take the leg off and remove the liner, drain out the contents of Sydney Harbour, dry off my stump and liner and replace before heading off again. I carry a small hand towel with me for the job. Some days I've gone 90-minutes without a change, other days I need to stop after less than half an hour.

Over time I'm beginning to get to know handy spots to do that - all I really need is something to lean the bike against and something I can sit on. Walking is not easy with the prosthetic cycling leg attachment, so I basically need to be able to ride up to the spot. As with most things, you get creative in working out little solutions for these things.

The reason why I need to stop is that as the liner works loose, the amount of surface area contact between my stump and the prosthetic socket reduces. Since the forces are transferred to the pedals via my socket, then the greater the amount of my stump's surface area that remains in contact with the socket, the less pressure is placed on any one part of my stump and skin. I find that as the liner becomes loose, it gets harder to produce the power as well as becomming less comfortable to ride. As soon as I remove, dry and refit it, there is an immediate improvement in comfort and power.

The other issue I have is since the socket I current use for riding is my general purpose socket (which is designed for standing/walking and not bike riding) the socket shape is not ideal for the angles the knee goes through when pedalling. A large gap forms between the front of the top of my shin and the front of the socket. Currently I fill that gap with some foam and need to keep adjusting how much I use, to get the right balance between filling the gap and having a secure stump-socket connection and actually being able to get the leg properly secured into the socket.

When I finally get a dedicated cycling socket made, the socket shape will be different so that it will be more suitable for cycling. That'll happen some time this year, the timing on that needs to be agreed with my prosthetics specialist. Since I am now getting much fitter, I am losing the weight and with that comes subtle changes to my stump's size and shape, which affects the design. It's a tricky business.

Anyway, for now it's not stopping me from riding but I know a better solution exists.

Read More......

Friday, January 23, 2009

Insensitive / TSS^

No, it's not a "someone made an inappropriate remark" story! It's another power meter, cycling training item. So for those non-PM using readers who's eyes roll around the top of their head when I go on about this stuff, then you can look away now :D .....

There have been lots of comments lately on the Google groups wattage forum about the Normalised Power (NP) algorithm and whether it could be improved. The discussion, as they often do, has drifted a bit from that into - "could the Training Stress Score (TSS) metric be improved?"

Well can they? Possibly.
Should we bother? I'm not so sure it matters.

Maybe it's because of the insensitivity of these things. Lemme show you an example.

I have produced a standard Performance Manager Chart (PMC). It covers my riding since I started back on the bike last year (~ 7 months).

As an experiment, I decided to add onto it another version of the PMC, with data based on an augmented TSS (TSS^). In this case, the calculation of TSS is not a function of the ratio of NP to Functional Threshold Power (FTP) but expressed as a ratio to Maximal Aerobic Power (MAP).

Now there is no particular reason for doing it other than curiosity, nor would there be any great sense given the underlying physiological and other rationale for choosing FTP as the anchor point. But that's not my point. It's an experiment to see what it means, from the point of view of how we actually use the information to monitor and guide our training.
MAP for most people is typically 25% +/-3% higher than FTP and so by anchoring an augmented TSS calculation to MAP instead of FTP, that will of course change the way TSS is calculated (since now I get a much lower weighting for threshold work and have to exceed MAP for gains to be multiplied).

And the impact of changing the TSS calculation? Well that'll change the PMC and how we interpret our training, right? Well, maybe.

Here's the PMC chart with two sets of lines for ATL, CTL & TSB. Default time constants used. One is based on TSS, the other (right hand axis) is based on the augmented TSS, “TSS^”. As always, click on the pic for a closer look.


Anyway the fact that the augmented ATL^, CTL^ and TSB^ mimic the same patterns, just with different absolute values, should not be a surprise since there is a reasonably consistent relationship between FTP & MAP.

Of course the relationship between FTP & MAP does vary (which it has during the period in the above chart), and when it does there will be deviations (as can be seen in the different slopes of the CTL and CTL^ lines).

But even so, just look at how closely the TSB and TSB^ lines track each other. Yet I have changed the TSS weighting formula quite a bit by anchoring to MAP instead of to FTP.

So if I showed you those charts independently, and multiplied the right hand axis values by two, you simply would not know the difference and it certainly wouldn't provide any different or additional insight into what was going on with my training.


So what would a PMC look like using these other “improved” formula for NP and/or TSS? That's what I'd like to see. Can it really provide us with a better insight into what's going on with our training?

I suspect all the mucking about with alternative NP or TSS formula would do is simply produce slight variations in the PMC (maybe absolute numbers a little different here and there) but the underlying training patterns that emerge would be the same and the interpretation would be the same. And even if the patterns are different, we still have to look at them in the context of the composition of our training, rest of life factors etc just like we do now (or should do).

Basically the modelling is pretty insensitive.

But let's see some examples folks....

I'm always open to looking at things in different ways to help garner additional insight.

Read More......

Tuesday, January 13, 2009

Quadrant Analysis

Earlier I posted about a thought I had - to do a Quadrant Analysis (QA) on the power meter data from my Threshold Tolerance Intervals (TTIs), comparing TTIs done at my local training ground, Centennial Park Sydney, to TTIs done on my home trainer, Thunderbird 7.

Funny, in the several years I've been posting about power meter stuff, I haven't mentioned QA. Yet it is one many funky tools to help explain some the differences in the physiological demands of different types of rides.

I don't really have to go into much detail to explain it, since it's already been done by Dr Andrew Coggan and you can read all about it here.

But the short version is that QA is useful for examining the neuromuscular demands of a ride. Essentially it plots pedal forces versus pedal speed (the combination of both equaling power) for each data point recorded by the power meter. In this way, we can not only see how much power we produced during a ride but also gain additional insight into how we produced that power.

There are a number of ways such a plot can be used (e.g. examining and/or comparing ride data with your maximal pedal force-pedal velocity relationship) but I'll leave that for another day.


OK, so the plot is shown above. Let me run you through it:

- The vertical axis is Average Effective Pedal Force (AEPF - measured in Newtons)

- The horizontal axis is Circumferential Pedal Speed (CPV - measured in metres per second)

- Plotted in little red and blue dots/circles are the AEPF and CPV for each second of power recorded by the power meter. The data is from the "on" parts of my intervals only, that is just the time I spent at the intended effort. There is 40-minutes of data for each group.

- The green curved line shows the point at which pedal forces and pedal speeds, when combined, equal my Functional Threshold Power.

- the vertical and horizonal purple lines delineates the quadrants and represent 90rpm (with a 175mm crank) and 167 Newtons (or the same as applying a force of ~ 17kg).

The four quadrants represent:
I - high pedal speed & high force (e.g. sprinting at high speed)
II - low pedal speed & high force (e.g. hard efforts, such at track starts)
III - low pedal speed &low force (e.g. just noodling along at low rpm)
IV - high pedal speed & low force (e.g. spinning fast but easy downhill)

We plot AEPF and CPV, since from a neuromuscular point of view, what's important is both the force and speed of muscle constractions/movement. Investigating either AEPF or CPV in isolation from the other is a fairly pointless exercise. (Refer Pithy Power Proverb "Cadence is a Red Herring" - R. Chung).

We can only plot AEPF, since each point of power meter data covers one or more revolutions of the cranks, in other words, the average of the forces applied to the pedal for an entire rotation of the crank. What this doesn't show is the variability in forces applied around the various points in the crank's revolution. As we know though, the greatest forces are applied on the downstroke, and by a happy coincidence, the maximal force exerted on the downstroke by each leg is roughly double the AEPF*.

* post edit: it was pointed out to me by Robert Chung I had expressed this relationship incorrectly (I had said "the maximal force exerted by one leg is the roughly the same as AEPF") and made this correction to show what I originally said as well as what it should have said.

CPV is basically similar to pedalling cadence, so why don't I just show cadence instead, since most people can related to what 90 rpm is like? Well in this case, the crank length on each bike is different. On the road bike I have 175mm cranks and on T7 I have 170mm cranks. So at the same cadence, the CPV would be higher on the bike with longer cranks. Or for the same CPV, my cadence would be slower on the bike with longer cranks.

If however you were examining ride data from rides using the same length cranks, then certainly you could also show cadence.

OK, so what do we make of the plots of my TTIs?

Well the first thing is that the dots are quite tighly grouped near the centre of the chart, which is pretty typical for efforts of a time trial nature. Generally the flatter the terrain, the more tightly grouped the dots will appear for a quasi-steady state effort. This contrasts significantly to plots for track races, criteriums and rides over hillier terrain, where the dots are widely scattered around the chart. In rides like MTB, the technical nature of riding can see a rider bumping up towards their maximal AEPF-CPV curve quite frequently.

The next thing is how much more tightly grouped the blue dots (indoor trainer) are compared to the red dots from the outdoor ride in the park. This shows that while the average power from these efforts was very similar, there were still differences in how I produced that power in each case.

We can see that the dots are close the the green line (denoting a pedal force/speed combination at FTP) and that the effort, overall on average, was just below my FTP.

The red dots tend to parallel the shape of the green line, which is reflective of me seeking to maintain power within a desired band over slightly variable terrain (I think the total altitude change is ~ 16-18 metres over the course of a 3.8km loop, with a few ups 'n' downs along the way). My speed varied significantly with the terrain and my cadence varied as well, although not by as much as speed since I would change gear regularly.

So, when riding on a trainer, there is a tendency for the AEPF-CPV relationship to show more of a rifle like plot during such Threshold Tolerance effort, whereas outdoors on more variable terrain (and conditions) the plot looks a little more like it came from a shotgun, albeit it one with an odd shaped barrel!

Is it important?

Well it simply serves to show that similar efforts can have variable neuromuscular demands and even changes as small as this may affect the power one is capable of producing in a given scenario. It just emphasises the specificity principle.

If your time trials are outdoors, makes sure you do some time trial training outdoors and ensure your legs are ready for the more variable neuromuscular demands.

Read More......

Smith & Wesson

The indoor training Gods have spoken.

This morning was meant to be my Threshold Tolerance Intervals (TTIs) - the good ol' 2 x 20-min workout at near FTP. Target range at the moment for me is 91-96% of FTP (250-265W).

So I drive to park today, hop out to attach my leg and get bike ready, Sam was riding past and sees me so stops to say hello. I get my leg on and roll off, intending do a roll for a lap or two with Sam before getting into it. But of course after 3-min a spoke goes "ping" and that's was it, wheel not in a trainable condition unfortunately. Hop back in car and go home.

So I hop onto Thunderbird 7 instead.

Last week I did my TTIs in the park at 259W and 255W.
On T7 this morning: 258W and 266W.

I intend to do a Quadrant Analysis plot of the indoor vs. outdoor TTIs and post about that soon. I suspect we'll see the difference akin to the mark on a target made by a rifle and a gunshot.

Read More......